Market Profile - Daily updates

10/20/15 Recap and prep (for 10/21).

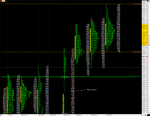
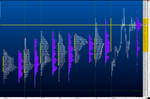
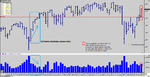
Still 1 T.F. higher and value is migrating along w price. Today's attempted direction was down. The morning rally high was met with some strong selling as seen in the graphic (today I left the actual volume text displayed for review on the profile), which left some nice excess. It's also technically a selling tail however with the amount of volume at the highs at the time it was real hard (at least for me) to interpret. An easily identifiable selling (or buying) tail will have declining volume creating it. Today's profile is fat indicating alot of two sided trade, leaving a very prominent TPO POC. What I find interesting is today's profile is almost identical to yesterday's if you were to turn it upside down. I'm leaning on a pull back at some point this week if not tomorrow, considering all of the above.

I'm also still using the monthly / sept FOMC spike high of 2011.75 as a go no/go level. Remaining above this level will indicate that bulls are still in charge. Breaking this level with acceptance may attract attention of longer term players. Which could take the mkt down further. If this happens, we have very poor structure to hold the mkt up (from the 10/15 profile).
 

Attachments

  • Profile1.png
    Profile1.png
    132.1 KB · Views: 195
  • Profile2.png
    Profile2.png
    90 KB · Views: 229
  • Profile3.png
    Profile3.png
    74.4 KB · Views: 215
10/21/15 Morning update.

Good morning. Overnight range is outside yesterday's range. Inventory is net long but not 100%. Currently trading above yesterday's value area. If we open under these conditions, the mkt may be in search of a new value area which at this time would be to the upside since that is where we are w price currently. Everyday since 10/15 value has been overlapping to higher. The opens have all been within the prior day's value area. So today being outside of yesterday's is something to carry forward. The top of yesterdays value area under these situations could offer some support (2026). Also, yesterday's TPO POC is very prominent, and these can draw price back to them as they are considered a form of an anomaly (2024.50) Should we begin trading back into yesterdays range and below the above mentioned levels, be reminded that it may be just an inventory adjustment. Inventory is considered adjusted when price trades back to the prior days settle - fyi. Good luck w your trading.

O/N high 2034.25
O/N low 2015.75
Prior pit high 2031.50
Prior pit low 2018.50
Settle 2021.25
Volume 174K as of 0550am PST
 

Attachments

  • Overnight1.png
    Overnight1.png
    140.6 KB · Views: 192
  • Overnight2.png
    Overnight2.png
    137 KB · Views: 188
10/21/15 Recap and prep (for 10/22).

Today will be a quick recap as I have some other obligations to attend to right now. It's quite obvious the bears were the victor today. Once the sellers were able to drive price down to yesterday's pit session low, buyers stepped in. This left a weak low (defined as price coming a tick or exactly to another reference). There were high odds this level would be revisited. This weak low was repaired and after a decent inventory adjustment from the liquidation in H period, sellers were able to get price below the monthly / sept FOMC spike high of 2011.75.
Remaining below this level tomorrow put focus on the downside, and we can assume the look above (2011.75) was a delayed failure.

Finding acceptance back above this level and we can consider that all auctions could still be pressing to the upside and today was a possible 'break before the rally' as Jim Dalton says.
Lastly, today's high is poor and weak in relation to yesterday's high.
 

Attachments

  • Profile2.png
    Profile2.png
    112.6 KB · Views: 223
  • Profile1.png
    Profile1.png
    108 KB · Views: 208
  • Daily.png
    Daily.png
    25.2 KB · Views: 194
10/23/15 Recap and prep (for 10/26).

In the last post I mentioned how Jim Dalton says sometimes a mkt has to break before it can rally. What we say yesterday confirmed this statement. Volume and price activity over the past couple of days is evidence of longer term players in this mkt as of current. The weekly volume also contributes to this evidence (see graphic).
Today the sellers made a failed attempt at closing the double digit gap. However, for large gaps, filling them only partially on the same day is not uncommon as they may not be filled for a couple of days. Also note that we are now above the 200Day MA on a Daily level (see graphic). I also have a level that personally I am using as a possible level to pay attention to on the upside. This level touches many data points for this whole year. It could mean nothing going forward. But being that markets are very visual and since on a profile level I see nothing to note as a target to the upside as of recent, this level may come into play. I have it as 2074.75. Ironic how the ONH is 1 tick below this level as well. Which reinforces my thoughts.
Today ends the 3rd week of 1T.F. higher. As long as this continues, nothing will change, obviously.
Have a great weekend.
 

Attachments

  • Weekly.png
    Weekly.png
    47.4 KB · Views: 204
  • Daily.png
    Daily.png
    70.7 KB · Views: 194
  • Profile1.png
    Profile1.png
    44.5 KB · Views: 180
  • Profile2.png
    Profile2.png
    49.4 KB · Views: 183
Top