Market Profile - Daily updates

08/31/15 Morning Update.

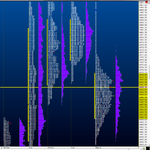
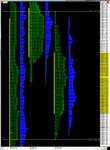
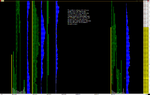
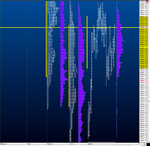
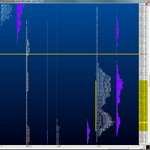
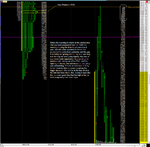
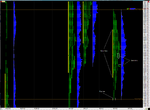
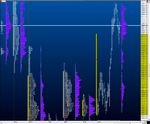
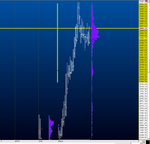
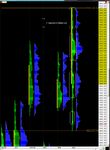
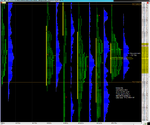
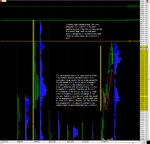
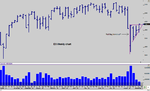
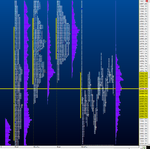
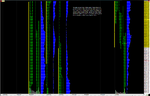
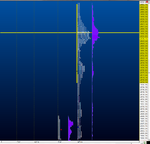
O/N volume is 242K as of 0545am PST. Overnight inventory presents itself as short. But when viewed on an expanded profile, we can see that the majority of the trade has been higher. These situations are difficult to distinguish. Currently a handle of gap to the downside. I doubt that will be the case come open. If we do open within Friday's range, balance rules apply. They are posted in Friday' Morning Update post.
O/N high 1977.25
O/N low 1959.25
Friday's pit high 2112
Friday's pit low 1971.5
Settle 1988.75
 

Attachments

  • Overnight1.png
    Overnight1.png
    125.8 KB · Views: 139
  • Overnight2.png
    Overnight2.png
    118.3 KB · Views: 189
8/31/15 Recap and prep (9/1/15)

. Light volume 1.86M contracts traded. Two sided trade today. Price probes on both ends of the range today didn't find acceptance. In fact, almost a repeat of Friday's action. Keeping this trade environment in the back of my mind allowed me to capitalize on trades today.
A frequent thing Jim Dalton always mentions is that traders will do what works until it doesn't. Today was an example of that.
Value was overlapping to lower. So now we are 1 T.F. lower on all three of the Daily, Weekly and Monthly timeframes.
I'd like to point out that price struggled around the POCs (both TPO and Vol) from last Thursday's (lower end of range today) and Friday's profile (upper range of today). On a daily chart, we now have a 3 day balance bracket with upper extreme (1990.25) and lower extreme (1944.25) to use as destinations for trade.
Ive added a note to a couple of the charts, worth a read.
 

Attachments

  • Monthly.png
    Monthly.png
    35.8 KB · Views: 176
  • Daily.png
    Daily.png
    24.9 KB · Views: 219
  • Profile1.png
    Profile1.png
    102.7 KB · Views: 141
  • Profile2.png
    Profile2.png
    115 KB · Views: 130
9/1/15 Morning Update.

China is weighing on world markets. I don't have much to bring as far as an analysis. O/N trade is 50 handles in range. Mkt is 40+ handles gap down, volume is high; 510K as of 0550am PST. I'm going to be sitting on the sidelines until some form of structure develops, if at all today. In looking for targets; to the upside is closing the gap left from 8/27/15 (1944.25), then of course the gap from today. Being so large, I doubt that will fill today.
To the downside I find myself looking at the weekly low from 8/26 week (1875). Then the O/N halfback at 1941.25 could be a level to enter or exit depending on what the mkt does around this level.
O/N high 1966.25
O/N low 1916.25
 

Attachments

  • Overnight2.png
    Overnight2.png
    71.5 KB · Views: 145
  • Overnight1.png
    Overnight1.png
    66.7 KB · Views: 193
9/1/15 Recap and prep (for 9/2/15).

Very sketchy trading day. When the profile is viewed expanded, it is quite obvious that the am session's attempted direction was up. D & E period was spent balancing (two-sided trade) - I noticed that in this balance, sellers were stepping in on every rally. Once G period opened up (9-930am PST), sellers prevailed and the mkt liquidated. The pm session's attempted direction was down. Conflicting info to say the least.
Viewing this on a bar chart is not quite so obvious. A bar chart's attempted direction today (say 30min) could easily be interpreted as down for the session.
Let's break down some structure:

> Value remained in the upper portion of today's range.
> TPO POC remained in the upper portion of today's range.

So, the information tells me that the mkt wasn't accepting the attempted direction being down. We are back inside the previous weeks 3 day balance bracket. Every one of these 3 days had very decent excess lows. This is evidence of aggressive buyers trying to take advantage of low prices.

> There are a few anomalies left in today's profile, evidence of emotional selling.
> We have a naked gap to repair to the upside, which failed to fill on 8/27.
> There is a prominent TPO POC (1972.75) from yesterday that usually attract price.

Prominent and very prominent TPO POC's are anomalies and they get repaired by being revisited by the market during day session hours.
Both the excess lows below, the naked gap, and the prominent TPO POC above makes a good case for the market to make a move up. Should we open higher tomorrow, we could get a decent short covering rally. But if we open with more weakness, I'll be ready for that mindset too.
 

Attachments

  • Profile1.png
    Profile1.png
    141.8 KB · Views: 124
  • Profile2.png
    Profile2.png
    157.9 KB · Views: 201
  • Profile3.png
    Profile3.png
    82.7 KB · Views: 177
  • Profile4.png
    Profile4.png
    61 KB · Views: 158
09/02/15 Morning Update.

O/N trade is in balance. Balance rules apply. 1) Look above or below and accelerate. 2) Look above or below and fail. 3) Remain within balance and rotate.
Looking at the O/N profile you can see most of the trade has been in the upper portion of yesterday's range.
O/N Inventory is long but not 100%.
O/N high 1939.00
O/N low 1907.25
Prior pit high 1939.5
Prior pit low 1898.75
Volume as of 0545am PST 338K
 

Attachments

  • Overnight2.png
    Overnight2.png
    94.7 KB · Views: 187
  • Overnight1.png
    Overnight1.png
    76.5 KB · Views: 220
09/02/15 Recap and prep (for 9/3).

Patience paid off today. From the open the mkt repaired the anomalies from yesterday, and adjusted the O/N inventory. I didnt trade this move, I never trade the first two sessions. Personal preference to save the monetary and emotional capital. But I was waiting to see what would happen after the 1st two periods; and after the following 1.5 hours of wide range balancing, we got the move up.

We also got a late day spike, which closed the gap from 8/27. We must wait until tomorrow's session to judge the movement for follow-through and conviction. I'm considering the base of the spike today's open.
Spike Trading Rules:
> Opening and remaining above spike. Very positive and suggests that the latest auction had not gone high enough to cut off the buying.
> Opening and remaining within the spike tells us that the spike was accepted; this would also be seen as positive as value would be developing higher.
> Opening below the spike or opening within the spike and quickly trading down below the base of the spike is negative telling us that the auction had gone high enough to attract sellers.

Today left a very prominent TPO POC. (Prominent = much more pronounced when reading from left to right. Very Prominent = 75% or more of the 30min periods). Carry this info fwd as a target should the mkt reject the spike come the open. Should the spike be accepted, then the destination becomes the gap close at 1962.25 from 8/31/15.
Most of the day was spent in balance, if the spike is accepted, I would see this as very positive as a breakout from balance and acceleration.
 

Attachments

  • Profile1.png
    Profile1.png
    137.6 KB · Views: 149
  • Profile2.png
    Profile2.png
    136 KB · Views: 153
09/03/15 Morning Update.

Currently trading a 10 handle gap up. Recall the spike rule "Opening and remaining above spike. Very positive and suggests that the latest auction had not gone high enough to cut off the buying."
Gap rules in play today,
1) Go with all gaps that don’t fill right away. That means if it doesn’t back off early it’s probably not going to and is going higher.
2) . Large gaps (10+) may not fill or may fill only partially on the first day. Pay attention to “halfback” of the gap distance.
3) If the gap fills and value cannot get to at least overlapping, there will probably be a late day rally.

O/N high 1968.75
O/N low 1944.25
Prior pit high 1948.25
Prior pit low 1916.25
Volume: 276K as of 0550am PST
 

Attachments

  • Overnight1.png
    Overnight1.png
    86.9 KB · Views: 141
  • Overnight2.png
    Overnight2.png
    68.6 KB · Views: 192
09/03/15 Recap and prep (for 9/4/15).

Attempted direction overall today was down, with lower volume and higher value indicates a strong directional performance. Another text book day as far as the Market Profile concepts go;

Let's go over what happened:
Decent conviction to the upside off the open. The mkt closed the upside gap from 9/1, and took out the naked TPO POC (very prominent one) from 8/31. Prominent and very prominent TPO POC's are considered anomalies and have a strong draw to price returning to them.

Then, we had nice long liquidation for several periods.
The rest of the day following the high was spent adjusting the long inventory from yesterday, and overnight. Sellers were taking advantage of this event and selling every rally pretty much into the close.

The mkt closed the gap from today's open as well.
There is evidence of forcing action on the way down today indicated by the number of anomalies left in the profile. These are created by emotional traders, day timeframe mostly.

We are 1 T.F. higher on a daily basis for 2 days now.

Tomorrow I've heard the floor clears out by half day on this 3 day weekend. Keep this in the back of your mind if you are trading
 

Attachments

  • Profile3.png
    Profile3.png
    99.9 KB · Views: 176
  • Profile2.png
    Profile2.png
    104.7 KB · Views: 210
  • Profile1.png
    Profile1.png
    123.6 KB · Views: 148
  • Daily.png
    Daily.png
    26.2 KB · Views: 164
09/04/15 Morning Update.

Trading out of balance (relative to yesterday) to the downside with a 37 handle gap.
Gap rules apply.
1) Go with all gaps that don’t fill right away. That means if it doesn’t back off early it’s probably not going to and is going higher.
2) . Large gaps (10+) may not fill or may fill only partially on the first day. Pay attention to “halfback” of the gap distance.
3) If the gap fills and value cannot get to at least overlapping, there will probably be a late day rally.

Should the mkt open and trade with the gap a couple of targets could be pit lows from 9/1 and 9/2 at 1916.25 and 1898.75(which is this weeks low).
A few targets should the mkt attempt to close the gap could be the prominent TPO POC from 9/2 at 1932.25. If the gap closes, the anomalies I discussed in yesterdays recap come into play.

O/N high 1949.25
O/N low - making new lows at this time so I will not post
Prior pit high 1973.50
Prior pit low 1942
Settle 1945.75
Volume 436K as of 0600am PST
 

Attachments

  • Overnight1.png
    Overnight1.png
    114.2 KB · Views: 173
  • Overnight2.png
    Overnight2.png
    130.7 KB · Views: 177
09/04/15 Recap and prep (for 9/8/15)

Lower volume, lower value, and attempted direction being down suggests a slowing market. Last week was an inside week, a form of balance. Combining the short inventory from O/N trade before Friday's open and sellers pushing the market lower in the day session, this contributed to the short covering rally we saw in the PM session.

The selling left a poor low (evidence of traders getting themselves too short), and a couple of anomalies in the profile (evidence of forcing action).

Both the TPO POC and the value area remained in the center of the range from Friday. Which can be interpreted as a balancing day. No real bias for Tuesday as on a daily chart it's obvious the mkt is in some chop.
 

Attachments

  • profile1.png
    profile1.png
    154.7 KB · Views: 180
  • Daily.png
    Daily.png
    30.7 KB · Views: 178
  • Weekly.png
    Weekly.png
    32.1 KB · Views: 135
09/08/15 Morning update.

O/N inventory is 100% long and currently mkt is trading a 10 handle gap to the upside. I am using Friday's pit session high for measurement of the gap. Mkt is also out of balance to the upside. Once again apply gap rules for today's trade.

1) Go with all gaps that don’t fill right away. That means if it doesn’t back off early it’s probably not going to and is going higher.
2) . Large gaps (10+) may not fill or may fill only partially on the first day. Pay attention to “halfback” of the gap distance.
3) If the gap fills and value cannot get to at least overlapping, there will probably be a late day rally.

O/N high 1961
O/N low 1930
Friday's pit session high 1930.75
Friday's pit session low 1907.75
Volume as of 0545am PST 467K
Friday's settle 1921.25
 

Attachments

  • Overnight1.png
    Overnight1.png
    114.9 KB · Views: 208
  • Overnight2.png
    Overnight2.png
    109.2 KB · Views: 212
090815 Recap and prep (for 090915).

Attempted direction today over all was higher, with lower volume, and higher value (relative to Friday's session) implies a slowing market. Some conflicting info to this assessment is the fact that we held the gap up today, and contrary to the positive side of holding the gap, value nor the TPO POC migrated with price today.

Once again, evidence of forcing action on the way up today, as it left a few anomalies in the profile, a prominent TPO POC being one of them. Anomalies get repaired by being revisited by price during day time trading hours only.

Today's rally was a short covering rally. One indication I mentioned above was how it left anomalies, but another tell is the 'b' formation prior to a short covering rally. These 'b' patterns are formed by traders getting themselves too short. The opposite is a 'p' pattern, when traders get themselves too long (potential for long liquidation. These resulting events do not necessarily have to happen on the same day) I've split my profile out so this pattern can be viewed easily in a graphic.
The last 8 eight days have had some odd behavior - reference the daily chart.
 

Attachments

  • Daily.png
    Daily.png
    29.4 KB · Views: 213
  • Profile1.png
    Profile1.png
    73.9 KB · Views: 219
  • Profile2.png
    Profile2.png
    80.2 KB · Views: 241
090915 Morning update.

O/N inventory is net long, but not 100%. Same situation as yesterday, trading a large 10+ handle gap to the upside. Gap rules apply.
1) Go with all gaps that don’t fill right away. That means if it doesn’t back off early it’s probably not going to and is going higher.
2) . Large gaps (10+) may not fill or may fill only partially on the first day. Pay attention to “halfback” of the gap distance.
3) If the gap fills and value cannot get to at least overlapping, there will probably be a late day rally.

A point of interest is the O/N high at 1992. The weekly (pit session) high from 8/28 is 1991. On a weekly level we have a 3 week balance area. I'm applying balance rules to this area.
1) Look above and accelerate.
2) Look above and fail (O/N low on the short term becomes the target)
3) Remain within this balance area and rotate.

O/N high 1992
O/N low 1964
Prior pit session high 1968.75
Prior pit session low 1944
Settle 1966
Volume 267K as of 0545am PST
 

Attachments

  • Overnight2.png
    Overnight2.png
    53.8 KB · Views: 156
  • Overnight1.png
    Overnight1.png
    56.3 KB · Views: 153
  • Weekly.png
    Weekly.png
    33.2 KB · Views: 173
090915 Recap and prep (for 09/10).

Today's structure was very poor. This is evidenced by a quadruple distribution (distributions are separated by single print TPO's), and several anomalies. Long liquidation was the game today. Starting w last Sunday's afternoon session, every session (day and night) up to today was accumulating long inventory. Traders who were prepared had several opportunities to get a piece of today's adjustment of this long inventory.

Today's value area remained overlapping to higher, and the TPO POC remained in the upper portion of the range. Was today merely an inventory adjustment? Dalton has said several times that before a mkt can rally it has to break. With the poor structure of the recent profile's I believe it's safe to assume that the longs were weak longs.

The balancing bracket on the daily chart is becoming more obvious, with today's settle (1943.25) putting us for all intent, right in the middle of this balance. With such a wide range today, tomorrow may be nothing but an inside day while the market absorbs the price action today. Something to keep in mind.

If we open tomorrow and continue to the downside, there is a poor low at 1907.75 from 9/4 that may be a destination trade. Also, the bottom of the current daily balance traders could target as well.
 

Attachments

  • Daily.png
    Daily.png
    41.2 KB · Views: 121
  • Profile1.png
    Profile1.png
    66.5 KB · Views: 121
091015 Morning update.

Currently trading a 5 handle gap to the downside. Gap trading rules apply. Seems to the norm' lately.
1) Go with all gaps that don’t fill right away. That means if it doesn’t back off early it’s probably not going to and is going higher.
2) If the gap fills and value cannot get to at least overlapping, there will probably be a late day rally.

O/N inventory appears to be balanced.
Keep in mind should we open and auction to the downside, the potential destinations.

O/N high 1964
O/N low 1923.75
Prior pit high 1987.5
Prior pit low 1935.5
Settle 1943.25
O/N volume 521K as of 0545am PST

I'll be leaving out of town later this am for the weekend. I won't be able to post until Sunday. Have a great weekend!

CORRECTION: I noticed on a couple of my other platform bar charts, the O/N low is actually 1928.5
My profile platform has it incorrect. Once I restarted it, it corrected itself.
 

Attachments

  • Overnight2.png
    Overnight2.png
    92.6 KB · Views: 147
  • Overnight1.png
    Overnight1.png
    104 KB · Views: 145
Last edited:
09/14/15 Recap and prep (for 09/15)

3 days of overlapping value and balance. Today's profile was extremely wide, leaving a very prominent TPO POC behind. These have a high tendency to be revisited by the mkt at some point. We have a balance forming within a larger balance area on the daily chart. See graphic. I've read a few articles and have heard a few news reports that this weeks FOMC (Thurs) is expected to produce a lot of volatility. I doubt there will be much conviction in either direction leading up to this day.
 

Attachments

  • Daily.png
    Daily.png
    29.8 KB · Views: 126
  • Profile1.png
    Profile1.png
    169.9 KB · Views: 138
091515 Morning Update.

O/N Inventory well balanced. O/N trade has except for a few ticks, within yesterdays range. Balance rules apply today.
1) Look above or below and accelerate. Either direction would target the bracket extremes discussed yesterday.
2) Look above or below and fail. The opposite extreme of the trading range.
3) Remain within balance and rotate.

O/N high 1949.5
O/N low 1935.25
Prior pit high 1952.5
Prior pit low 1936.5
Settle 1943.25
Volume 281K as of 0550am PST
 

Attachments

  • Overnight1.png
    Overnight1.png
    109.2 KB · Views: 127
  • Overnight2.png
    Overnight2.png
    102.4 KB · Views: 126
09/15/15 Recap and prep (for 9/16).

Attempted direction today obviously was to the upside, higher volume and higher value implies a very strong directional performance. Today was a classic breakout of balance and accelerate.
Let's breakdown what did and didn't happen and was a vital clue for the rest of the session:
'C' period (I start my profile in A) took out the naked POC's (both TPO and Volume) from 9/9, the mkt found two sided trade in 'D' period, all of this sitting above the 3 day's of balance. Once 'E' opened and sellers couldn't drive prices back into the 3 day balance area, the bulls took over for the remainder of the day. Buyers stepped in two ticks above the balance high. This was a strong signal that we were going higher.

We are now 1 T.F. higher on a daily basis, and out of balance to the upside from the previous 3 day balance we were in. The current destination is the upper extreme of the larger balance bracket at 1981.75.

I don't much follow chart patterns but I notice that on a weekly chart there appears to be a bull flag forming. Not sure if this means anything or not, just thought I would mention it.
 

Attachments

  • Profile2.png
    Profile2.png
    90.7 KB · Views: 141
  • Profile1.png
    Profile1.png
    95.8 KB · Views: 122
  • Weekly.png
    Weekly.png
    23.6 KB · Views: 146
09/16/15 Morning Update

Good morning. We are well balanced with O/N inventory short but not 100%. Balance rules apply.
1) Look above or below and accelerate. To the upside would target the 2 weekly highs (discussed in yesterday's recap), the 2nd weekly high being the upper extreme of a 14 day balance. To the downside would target yesterdays prior pit low.
2) Look above or below and fail. The opposite extreme of the trading range.
3) Remain within balance and rotate.

O/N high 1972.75
O/N low 1962.75
Prior pit high 1973
Prior pit low 1943.5
Settle 1969.75
O/N volume 235K as of 0550am PST
 

Attachments

  • Overnight1.png
    Overnight1.png
    63.6 KB · Views: 151
  • Overnight2.png
    Overnight2.png
    70.5 KB · Views: 129
09/16/15 Recap and prep (for 9/17)

Yesterday's recap talked about the strong directional performance. Today continued that sentiment. Volume pretty much unchanged with higher value is evidence of this confidence.
The mkt settled above the outer daily balance discussed in the 9/14 recap. Also, we broke out the the bull flag pattern I lightly mentioned yesterday. I say light because I don't trade using patterns, just pointed it out because it appeared real obvious and markets are very visual so thought I would mention it.

Let's talk about today's price action as far as the profile is concerned:
'D' period rallied to last weeks high and struggled through 'E' period - good exit point. The following 4 periods (F,G,H,I) was two sided traded, yet traders were able to take out the upper extreme of the outer balance area I've mentioned (this was also a weekly high - weekly/ monthly levels tend to attract intermediate term and higher timeframe traders). All of this was obvious, as a 'this is what 'did' happen' type of analysis.'

Let's point out what didn't happen:
'K' was not able to take out the low of 'J' period, and the afternoon grind higher was the game into the close. This event in 'K' period proved to me that the break in 'J' was a moderate inventory adjustment as opposed to a full on long liquidation. I was expecting more from the liquidation to be frank. At the time 'J' liquidated, the low of this period was exactly half back, another clue that buyers were waiting there.

It's hard to take advantage of these situations as they fly right in the face of recent activity - something I still get sweaty palms and nerves over. But this one paid off for those traders who trust themselves and know
 

Attachments

  • Weekly.png
    Weekly.png
    23.7 KB · Views: 114
  • Daily.png
    Daily.png
    26.6 KB · Views: 125
  • Profile1.png
    Profile1.png
    78.2 KB · Views: 131
Top