isatrader
Senior member
- Messages
- 2,964
- Likes
- 135
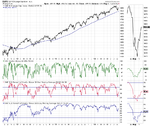
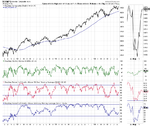
Nasdaq Market Breadth Update
The Nasdaq Bullish Percent Index


Nasdaq Percentage of Stocks above their 200 Day, 150 Day and 50 Day Moving Averages P&F charts


Nasdaq Percentage of Stocks above their 200 Day, 150 Day and 50 Day Moving Averages line charts


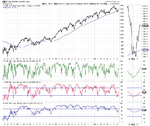
Nasdaq Advance Decline Line

Nasdaq New Highs New Lows


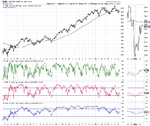
The Nasdaq Bullish Percent Index
Nasdaq Percentage of Stocks above their 200 Day, 150 Day and 50 Day Moving Averages P&F charts
Nasdaq Percentage of Stocks above their 200 Day, 150 Day and 50 Day Moving Averages line charts
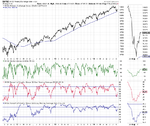
Nasdaq Advance Decline Line
Nasdaq New Highs New Lows