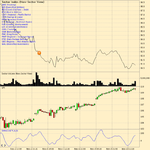
MACCI tells us INDU is going down today?

Hi Charlton,
Thanks for the explanation (y)
But is this the common practise to choose day-trading stocks by filtering them from swing trading candidates ? If not, what is the common practise to choose day-trading stocks?

Regards,
Albert
They would be good candidates for swing trading, but equally you could feed them into your radar screen containing the Iraj N min change and a row for $INDU. Their relative strength, as I explained in an earlier post, would show how they are currently performing during the current session and hence you would be sorting them into a few potential candidates for daytrading

It's not an exact science so it is best to try it out on a SIM account first to see how the stronger and weaker stocks move compared to market movement,

What you are doing is reducing risk by lining up more things in your favour.


Charlton
 
Hi Charlton,
Thanks for the explanation (y)
But is this the common practise to choose day-trading stocks by filtering them from swing trading candidates ? If not, what is the common practise to choose day-trading stocks?

Regards,
Albert
I think the most important point that you are missing is the sorting by relative strength of the stocks compared to $INDU. That is the bit that determines whether the stock is suitable for trading within the day.

If a stock is weak or strong for swing trading as determined by other analysis/screeners such as FINVIZ why should it not be a candidate for day trading. Choose about 20 stocks to put onto your radar screen from the strong and weak lists and you should find up to about 5 of them that are suitable candidates in terms of relative strength. You don't want more than 5 otherwise it's difficult to control.

What follows is based on notes taken during one of Iraj's sessions (I think it was know as session 2):

What crieria do you use to choose stocks for day trading ? - the ones on the list about 25 of them that have good volume and you can get into.out of them fast. Mostly NASDAQ with narrow spread and good volatility. The list at the time which was 28th Feb 2008 was SLB, AKAM, X, CCJ, RIG, BHL, EBAY, WFT, CELG, JOYG, QCOM, SNDK, AAPL, ERTS, YHOO, RIMM, KLAC, BBY, LRCX, CAT, AMGN, COST, BRCM, AMZN, NVDA

Do you tend to have your favourite stock that you tend to trade more than others ? - RIMM, AAPL, AMZN for scalping

What is your take on high beta stocks vs low beta stocks when day trading ? - stocks that are high beta are much much weaker than the market and fall faster. We wait for 10 min INDU to be overbought and then short. Stocks hovering around same ATR as INDU are called market stocks and have no individual character, so they go up exactly as market up and down - these are netural stocks so useless for trading

But I go back to my point that amongst the 20 - 30 stocks you put on the radar screen (chosen by whatever method you want) it is their relative strength during the day that matters, such that you arrive at a basket of 3-4 stocks that are either te top strongest or top weakest as appropriate for the day

Charlton
 
Hi dcraig1,
Yup ,TT turns out to be more active than its seems, glad many senior TTs are still looking after this place :clap:

Thanks for the extra stock screening filter, but is there a actual applicable filter that I can find within Finviz or I have to keep an eye on EPS release news all the time?

Cheers
Albert


It's good to see a bit of activity on technical trader once again.

On the topic of stock screening (for swing trading) , in my work I have found that one of the more useful metrics is the % by which a stock exceeded or failed to meet analysts estimates on the most recent earnings release. Of course this doesn't mean buy or short on the stock on the day of release, but does have some edge in predicting future strength or weakness.

I believe Iraj mentioned this somewhere.
 
Last edited:
Hi dcraig1,
Thanks for the nice chats (y)
Are you saying you got two lists: one strong stock list & one weak stock list(about 100 each), presumably you got those two lists via FA?

And you use those stocks within those two lists to form two unweighted indices like SPY?
Then you use your algorithm(presumably the 35 bars sharp ratio one? ) to further select strong/weak stock of the day for day-trading based on ATR?

I cannot find the evidence of "The strong stocks are up ~4% beating the index by ~3% and the weak stocks are down about 1%, beating index by ~2%." in the charts, could you explain where I missed that?

And why you attached SPY for both index? What is the relationship between them?

I don't really understand this " 35bar sharpe ratio on 30 min data, but a simple ROC would probably do as well." , could you also explain that?

Sorry for so many questions and requests for verification.

Many Thanks
Albert

To illustrate the importance of what Charlton is saying about strong and weak stocks, attached are charts of unweighted indices of a group of strong stocks and a group a weak stocks. Also plotted on the charts is the SPY. The stocks were automatically selected from my list of strong stocks and list of weak stocks (about 100 of each). The screening date/time is shown by the "!" icon on the chart. The screen date/time corresponds to a highish MACCI for weak stocks and a lowish MACCI for strong stocks. The strong stocks are up ~4% beating the index by ~3% and the weak stocks are down about 1%, beating index by ~2%.

The screen to select (from my already preselected universes of strong and weak) was a 35bar sharpe ratio on 30 min data, but a simple ROC would probably do as well.

There is no "future knowledge" in these screens. I do not use Iraj's TS code or screens or FINVIZ, but the principles are just the same.
 
Hi Charlton,
Thanks very much for the detailed explanation and examples (y)
In summary , should it be:
we use rader to find
1>
stocks with higher ATR than INDU's (top strongest)
2>
stocks with lower ATR than INDU's (top weakest)
3>
And we simply ignore market stocks(stocks hovering around same ATR as INDU )

from pre-selected strong/weak stocks within the day ?

Just one more thing re high/low beta stocks you mentioned:
"stocks that are high beta are much much weaker than the market and fall faster".
As far as I understand,high beta only means more volatility than its belonged market, so potentially high beta could also be much stronger than market and up faster?
Therefor we could long it when 10 mins OS as well? Please correct me if I am wrong.

Cheers
Albert

I think the most important point that you are missing is the sorting by relative strength of the stocks compared to $INDU. That is the bit that determines whether the stock is suitable for trading within the day.

If a stock is weak or strong for swing trading as determined by other analysis/screeners such as FINVIZ why should it not be a candidate for day trading. Choose about 20 stocks to put onto your radar screen from the strong and weak lists and you should find up to about 5 of them that are suitable candidates in terms of relative strength. You don't want more than 5 otherwise it's difficult to control.

What follows is based on notes taken during one of Iraj's sessions (I think it was know as session 2):

What crieria do you use to choose stocks for day trading ? - the ones on the list about 25 of them that have good volume and you can get into.out of them fast. Mostly NASDAQ with narrow spread and good volatility. The list at the time which was 28th Feb 2008 was SLB, AKAM, X, CCJ, RIG, BHL, EBAY, WFT, CELG, JOYG, QCOM, SNDK, AAPL, ERTS, YHOO, RIMM, KLAC, BBY, LRCX, CAT, AMGN, COST, BRCM, AMZN, NVDA

Do you tend to have your favourite stock that you tend to trade more than others ? - RIMM, AAPL, AMZN for scalping

What is your take on high beta stocks vs low beta stocks when day trading ? - stocks that are high beta are much much weaker than the market and fall faster. We wait for 10 min INDU to be overbought and then short. Stocks hovering around same ATR as INDU are called market stocks and have no individual character, so they go up exactly as market up and down - these are netural stocks so useless for trading

But I go back to my point that amongst the 20 - 30 stocks you put on the radar screen (chosen by whatever method you want) it is their relative strength during the day that matters, such that you arrive at a basket of 3-4 stocks that are either te top strongest or top weakest as appropriate for the day

Charlton
 
Hi Charlton,
Thanks very much for the detailed explanation and examples (y)
In summary , should it be:
we use rader to find
1>
stocks with higher ATR than INDU's (top strongest)
2>
stocks with lower ATR than INDU's (top weakest)
3>
And we simply ignore market stocks(stocks hovering around same ATR as INDU )

from pre-selected strong/weak stocks within the day ?
Correct - you are trying to create a basket of stocks to spread risk. You are probably looking for around 3-4, unless you are one of those people who can pat your head and rub your tummy at the same time. You determine market direction and if it is heading up you are looking for the top 3-4 strongest stocks relative to INDU using the N min change code (ATR column).
Just one more thing re high/low beta stocks you mentioned:
"stocks that are high beta are much much weaker than the market and fall faster".
As far as I understand,high beta only means more volatility than its belonged market, so potentially high beta could also be much stronger than market and up faster?
Therefor we could long it when 10 mins OS as well? Please correct me if I am wrong.

Cheers
Albert
Correct - high beta simply means more volatile than the market, so these could fall faster or rise quicker than the market. Again you enter all the stocks you want to consider, say 20-30, that have the right characteristics of good volume, easy to enter/exit etc and then rank them in the N min change radar screen. Let it tell you what to pick.

Charlton
 
Hi Charlton,

Thanks very much for the confirmation and further illustration (y)

I understand diversification is one of the key items in terms of risk management, so it would be good to do a basket trade (more than dozens stocks) rather than manually make entry for a few stocks even in day-trading.

But as you mentioned monitoring more than 3-4 stocks for day-trading would be really hard all ready. So does this imply we should all have to make a automated system if we want to do decent day-trading? I have learned Iraj have a automated trading system that does everything for him, including stock picking(not sure if its based on Iraj's N mins?), position sizing according to ATR, make entry based on MTFs MACCI , make exit based on MTFs MACCI . Please correct me if I am wrong. So his automated trading system is generally used for day-trading? Is that correct?
But as far as I learned swing trading generally is more profitable than day-trading and that is the way to go. Is this correct? If so, I assume Iraj's automated system could do swing trade as well as he is a fantastic trader.

Many Thanks
Albert

Correct - you are trying to create a basket of stocks to spread risk. You are probably looking for around 3-4, unless you are one of those people who can pat your head and rub your tummy at the same time. You determine market direction and if it is heading up you are looking for the top 3-4 strongest stocks relative to INDU using the N min change code (ATR column).

Correct - high beta simply means more volatile than the market, so these could fall faster or rise quicker than the market. Again you enter all the stocks you want to consider, say 20-30, that have the right characteristics of good volume, easy to enter/exit etc and then rank them in the N min change radar screen. Let it tell you what to pick.

Charlton
 
Iraj would often have 8 or more stocks that were being basket traded on an intr-day basis. He had developed an approach that would do this completely automatically. All stocks were also in Radarscreen so that it was clear which stocks should be traded and which shouldn't. However what you should know is that Iraj does not use Macci to trade and was only giving that approach to use as an example of how you can trade. His actual approach was based very much on Cycle analysis (which he did not reveal to us) and has a lot to do with the work of John Ehlers.


Paul
It seems getting into rocket science :confused:

So do seniro TTs have a conclusion here that how much MTFs MACCI(30,60 min) itself could help us determine the market direction in a general technical day ? Or MACCI has proven more useful helping us make an entry on lower time frame(1, 3, 5,10 min) break out ?

Regards,
Albert
 
John Ehlers has a "signals" website here:

http://www.eminiz.com/in/default.aspx

The corona charts are worth a look to get a flavor of his stuff:

http://www.eminiz.com/in/AllCoronas.aspx

His ES P&L doesn't look too flash at the moment.

Thanks for the link, I had a look, those P&L generous don't look too flash apart from
NQ.
Does that suggest John Elher's model is still not good enough and need some improvement as well ?

BTW I have found another related John Elher website @ http://www.mesasoftware.com/.

Regards,
Albert
 
Does that suggest John Elher's model is still not good enough and need some improvement as well ?

But the equity curve could look quite different if instead of buying for example the ES, one bought strong stocks and instead of shorting the ES, shorting weak stocks using the signals on the ES for timing. This is the message, I believe that Iraj was always trying to get across - try to identify the cycles in the broad market then trade the appropriate stocks. A message applicable to any time frame.

Intuitively this always appealed to me, because it adds an extra degree of freedom. An index trader trades what they are given. A stock trader chooses their market(s). It is that extra bit of input that may be the difference between success and failure.

Of course this really does beg the question of how to determine what is a strong stock and what is a weak stock. This is really a huge topic. For example, I think small caps do better coming out of a bear market and large caps towards the end of the bull - but that may not always be true either. Do fundamentals such as the much hyped PEG have much of a use anymore when everybody and his dog focus on it?

An equally important issue is how to know when the market is not in a cyclical mode ie strongly trending. This ain't easy. Keeping up with news is one part of this. I guess experience is another. Ehlers tries to use some measures of trend strength.
 
Does that suggest John Elher's model is still not good enough and need some improvement as well ?

As to the inherent merits of Ehler's signal processing approach, all I can say is that I haven't really been able to find them. To be fair I've never tried MESA, for which he charges money and claims to be superior to the stuff published in his free papers.

I'm not saying there is no value in it, and I believe there are some here that do use things like his inverse fisher transform and consider it useful.

Another vendor who also travels the signal processing route is Jurik. All his stuff costs money. It might be worth having a look.
 
Are you saying you got two lists: one strong stock list & one weak stock list(about 100 each), presumably you got those two lists via FA?

No, the screening uses both FA and TA. (I need as much help as I can get!)

I wrote my own stock screener and get the data from Yahoo Finance. It is time stamped and maintained in a MySQL database so I am accumulating over time a historical fundamental database for most US stocks along with historical price time series data. Without going into all the details, my preferred screens use sharpe ratios calculated over 1 year and 3 month period, % earnings surprise and Yahoo's enterprise value compared to market cap. Other screens use price/sales ratios, PEs and some other things. As I accumulate more and more historical fundamental data, no doubt my views
on screening will evolve.

Most of the screeners on the web work along the lines of "select stocks where condition1 AND condition2 AND ......"

My screener can do that but also things like "sort stocks by key1, take the top 200 and sort by key2 take the top 50 and ........." where key1, key2 are either fundamental or technical metrics.

It can also work near "real time" for technicals just like Radar Screen :)

And you use those stocks within those two lists to form two unweighted indices like SPY?

Then you use your algorithm(presumably the 35 bars sharp ratio one? ) to further select strong/weak stock of the day for day-trading based on ATR?

These two lists are really just watch lists. The top plot or "index" was derived by screening from the watch lists and composed of just the stocks listed on the chart. These stock are intended for swing trading - some almost certainly are not liquid enough for day trading.

I cannot find the evidence of "The strong stocks are up ~4% beating the index by ~3% and the weak stocks are down about 1%, beating index by ~2%." in the charts, could you explain where I missed that?

And why you attached SPY for both index? What is the relationship between them?

Sorry - I was a bit indiscriminate in my use of the term "index". I should have said in relation to the broad market for which I am using SPY as a benchmark. I should have said the selected strong stocks beat the SPY by ~3% etc.

I don't really understand this " 35bar sharpe ratio on 30 min data, but a simple ROC would probably do as well." , could you also explain that?

I kind of like the Sharpe ratio as technical measure of strength/weakness, because it tends to favor stocks with a smoother trend, rather than stocks that have highly volatile short term behavior. It is a long way from perfect. Rate of Change (ROC, Momentum) can also be used to rank strength/weakness, but makes no account of short term volatility. In it's proper definition, Sharpe ratio is calculated over a year period with some risk free rate of return for benchmarking investments and trading systems, but you can calculate it over any period on any time series with some sort of notional risk free ROR to achieve a relative ranking of stocks. I think the lookback period should bear some relation to the previous high/lows of the time frame you are interested in.
 
Here is the performance of the weak "portfolio" a couple of days down the track. I always think it is more interesting to look at risk if one gets overall market direction wrong.

In absolute terms it is down about 1%. Relative to the broad market (using SPY as a proxy) it is down almost 5%. This again I think reinforces the merits of trading stocks rather than index IF you get your stock selection right. This is by far the most important thing that I took from Iraj's posts.

IMHO outperforming the broad market by 5% over 5 trading days is pretty damned good, and begs the question of what is going to happen to these stocks when the market turns.

The fact that these stocks are so weak is, I believe, indicative of declining market breadth which is characteristic of the mature stage of a bull run. This separation of the market into "haves" and "have nots" was very evident to me in the April-May period last year, though my analysis tools were not as good as I have now. I would be very interested to hear any other opinions about market breadth, as I do think it tells quite an interesting story.

I was going to finish the post with "Buyer Beware!", but Mr Market may make a fool of me yet.
 
Oops ... forgot the attachment:
 

Attachments

  • weak1.png
    weak1.png
    37.2 KB · Views: 23
...... begs the question of what is going to happen to these stocks when the market turns.

The fact that these stocks are so weak is, I believe, indicative of declining market breadth which is characteristic of the mature stage of a bull run. This separation of the market into "haves" and "have nots" was very evident to me in the April-May period last year, though my analysis tools were not as good as I have now. I would be very interested to hear any other opinions about market breadth, as I do think it tells quite an interesting story.

"...when the market turns"
Long anticipated in many quarters. It seems it's more a question of IF it turns rather than when at the moment. I'm bearish but "markets can stay irrational longer than you can stay solvent".

There are many ways to look at the internals and draw conclusions
Here is a current view of a variety of factors in play yesterday, inconclusive but interesting if you like that kind of thing:-.

"The bifurcated market behavior that has emerged over the past few days continued in today’s session. While the Dow Industrials closed up on the day, the S&P 500, as well as the secondary indexes all closed lower, albeit every so slightly lower in the S&P. It wasn’t a large move in either direction by any of the main stock indexes. And the same inter-market non-confirmation that we pointed out in last night’s Update between the Dow and S&P remains in place today. So while there was no solid upside-follow through to yesterday’s strong push, neither was there any strong desire to sell. Both NYSE and S&P 500 breadth were negative, meaning there were more shares down than up on the day. Total NYSE volume contracted to just over 1 billion shared traded (CQG data) and a modest 59 percent of the volume occurred on the downside.

When we step back and try to add together various pieces of the market puzzle, it still looks like a market that is in the process of rolling over. The higher-beta secondaries, which already broke their respective October 2 lows, remain relatively weak versus the blue chips. The bank sector, as well as the broader financials appear to have topped and peeled to the downside, as have the REITs. So too it appears that the XLE, the Energy SPDRs made its countertrend rally high on October 21, from the March low, as did the AMEX Telecom Index (PHN), which topped on September 28. Also, the retail sector (XRT) made a high on October 19, declined to November 2 with the broad market, and has so far made a partial upward retracement. And while both the Dow Transports and Utilities have rallied over the past week, both remain beneath their respective October highs, in contrast to the Industrials, which pushed to a new recovery high. The buying effort is becoming more concentrated in fewer areas, mainly now focused on the bluest of blue-chips, the DJIA. This is how markets make a top, as each sector and index peels away from the uptrend until there are only a few sectors holding the rally together, which then expires under its own weight. The question, of course, is if top tick is in place, or if the market rally in the Dow and S&P have a few breaths of life left. As long as the inter-market divergence between the two remains intact, the market holds the potential to turn down right now. If the S&P rises above 1101.36, its October 21 high, then the rally is still breathing."


And then there are the technicals, like the nearnesss of a 50% retracement from March and the gap in the Dow at 10313 (29/30 Sept 2008) still waiting to be filled.
I also think that the Dollar is key to everything that is going on. Markets will not come down until the Dollar starts to strengthen, and there are no plans for fiscal tightening at the moment. I'm watching the Dollar Index.
www.goldseek.com/quotes/charts/usdollar/usdollarindex5day.php

fwiw I'm already short and under water. If wrong and my stops are hit, fair enough, that's the game.

Glenn
 
Last edited by a moderator:
Well there was a technical reaction to the 50% retracement. It filled the gap at 10313 and tentatively crept up. The 50% was at ~ 10334 and it reversed from 10342.
I test-shorted it with 2 lots of YM, a bit early, and out at 15:52 for 32 points. Now to see if it remains weak to have another crack at it (famous last words as it runs away downhill - lol)
This could be the start of a major pullback or just another minor correction. We'll see.
Dollar index has perked up, GBP and EUR seem to be the reason for that. Oils and Gold are down too.
Glenn
 
Took longer than I thought, but I'm still long-term Short and have added more.
Dollar is rallying (as is VIX), Oil and Gold are still going down, and now Stocks are following.

Glenn
 
Top