You are using an out of date browser. It may not display this or other websites correctly.
You should upgrade or use an alternative browser.
You should upgrade or use an alternative browser.
Any one else also thinks INDU is going down now and its a good chance to short some weak US equities as a day trade based on MACCI?
I am just picking up Iraj's trading theories, not sure if I have leared that correctly or otherwise.
Regards,
Albert
First of all ask yourself on which timeframe(s) is it heading up or down.
Do the signals on several timeframes correspond with each other ?
What are the MACCI values on each timeframe ? Were they in overbought terrritory and now heading down or are they somewhere between overbought and oversold and just heading down ?
What timeframes are you looking at ?
By the time you have answered these questions and by the time that any of us have seen your question the situation may well have changed radically of course.
Should also add - what is the market doing ? Trending, consolidation. MACCI is an oscillator so it doesn do well in trending markets or where there is low volume.
Charlton
Last edited:
Gob00st
Member
- Messages
- 74
- Likes
- 2
Hi Charlton,
Thank you for your quick reply.👍
First of all ask yourself on which timeframe(s) is it heading up or down.
60 min and 30 min MACCI were going down the time when I posted .
Do the signals on several timeframes correspond with each other ?
Yes, two major time frames, 60 min and 30 min.
What are the MACCI values on each timeframe ? Were they in overbought terrritory and now heading down or are they somewhere between overbought and oversold and just heading down ?
Cannot remember exactly , both were in OB (> 100) and heading down.
What timeframes are you looking at ?
I remember Iraj said use 30 and 60 to determine market direction and use 5 and 10 to make entry ? So I am looking all of them, trying to determine the market direction and make some day trade(not scalping).
By the time you have answered these questions and by the time that any of us have seen your question the situation may well have changed radically of course.
Yes, 30 mins is heading up now.
Should also add - what is the market doing ? Trending, consolidation. MACCI is an oscillator so it doesn do well in trending markets or where there is low volume.
Thanks for remind me of that. Yes, MACCI is not that good for trending market.
But I am not sure how could you define today's market is trending or consolidation or both.
I think the market initially was trending huge in the first hour and then went into consolidation ? Please correct me if I am wrong.
Regards,
Albert
Last edited:
counter_violent
Legendary member
- Messages
- 12,672
- Likes
- 3,787
GobOOst
I'd like you to think about something here.
In my view the 30m time frame is neither here nor there and should be disregarded as it is simply 1/2 of the 1 hr and 2x the 15m .
When traders talk about time frames lining up, the time frames would need to have enough distance between them in order that difference has some meaning...so eg 4 hr 1hr 15m...all multiples of 4.
Gob00st
Member
- Messages
- 74
- Likes
- 2
Thanks for the tip counter_violent 👍
But could you explain why you think distance time frame(multiples of 4) lining up is superior than two adjacent time frame lining up?
Albert
But could you explain why you think distance time frame(multiples of 4) lining up is superior than two adjacent time frame lining up?
Albert
GobOOst
I'd like you to think about something here.
In my view the 30m time frame is neither here nor there and should be disregarded as it is simply 1/2 of the 1 hr and 2x the 15m .
When traders talk about time frames lining up, the time frames would need to have enough distance between them in order that difference has some meaning...so eg 4 hr 1hr 15m...all multiples of 4.
counter_violent
Legendary member
- Messages
- 12,672
- Likes
- 3,787
Ok , of all the standard time frames 1m 5m 15m 1hr 4hr 1day 1 week 1 month...the 30m somehow does not fit...it's simply too close to 15 and 1hr.....and 30m is (only in my view) not a standard time frame.
Consider a 1hr candle, now if you used a 15m time frame then thats 4 candles of information to make up your 1hr candle wheras it's only 2x 30m candles....so the question really is...do the 30m candles add anything meaningful in the observation of the price action on the 1hr time frame!
cheers
Consider a 1hr candle, now if you used a 15m time frame then thats 4 candles of information to make up your 1hr candle wheras it's only 2x 30m candles....so the question really is...do the 30m candles add anything meaningful in the observation of the price action on the 1hr time frame!
cheers
I think your analysis was pretty much spot on. Iraj used to emphasise 10 min as being the most important timeframe. Those below it are used for entry/exit and those above it for general market direction. One of the things you can do with Tradestation is to set up a radar screen where you put the MACCI on each row, but each one is set with a different timeframe, so you could have, say, 1,2,3,4,5,6 etc down to say 60. This makes it easy to see whether timeframes are lining up as overbought.oversold across several TFs at a glance. This kinda helps with the point made by counter_violent, because rather than concentrate on the values of single TFs you get an overall feel for whats happening in the longer term, mid term and short term.I think the market initially was trending huge in the first hour and then went into consolidation ? Please correct me if I am wrong.
Regards,
Albert
The next thing you might want to look at is to compare what is happening to MACCI, $INDU and various stocks at the same time.
The theories that Iraj expounded here were based upon a multi-timeframe top down approach, whereby certain stocks exhibited characteristics that made them weak or strong i.e. they moved more (in relative terms) than the market ($INDU) did within a particular period. The idea is that if they were stronger than the market and the market was going up, then even if the market turned down there would be a "delay" in the strong stock's reaction. Also if the market continued upwards the strong stocks would move more.
So you could test this out by comparing the movements as I say. You cannot compare these things directly because obviously the absolute moves in $INDU and each stock are price dependent, so you need to look at how far each has moved compared to the volatility of the stock or index.
There are posts within the TT thread that explain how to find strong/weak stocks or you could choose some using a screener like FINVIZ.COM. This has a nice heat-map that colours sectors and stocks accordingly.
So if you picked some of these and look at movements of $INDU, the values of MACCI and the movements of your stock selection, you would be able to see when and if MACCI can be used to help you trade the stocks. Also to what extent can the oscillation of MACCI during periods of consolidation act as a "predictor" of when a trade entry or exit can be made and which timeframes are best for this.
Basically by asking "Mr Market" this i.e. would you have made a profit on your, say, Apple trade consistently, you will be able to establish where it is likely to be useful in the future. Going back to your openining question on this thread, the market will tell you if you have learned Iraj's strategies correctly and if they prove true.
Charlton
Trader333
Moderator
- Messages
- 8,766
- Likes
- 1,030
Another key factor was that he basket traded with position sizing of each stock in the basket relative to its own volatility. That meant that overall he almost always made a profit because if, for example, INDU was going down then overall the basket of weak stocks would go down as well even if one or two went up.
Paul
Paul
Gob00st
Member
- Messages
- 74
- Likes
- 2
Hi counter_violent,
Thanks for your explanation, I see you point there, its quite reasonable.
But now I think its' a question of how to define a more effective break out by using multiple TFs ?
I am not sure if anyone in TT have tested this.
Does distance( *4 ) TFs lining up provides better break out signal than adjacent TFs lining up ?
Regards,
Albert
Ok , of all the standard time frames 1m 5m 15m 1hr 4hr 1day 1 week 1 month...the 30m somehow does not fit...it's simply too close to 15 and 1hr.....and 30m is (only in my view) not a standard time frame.
Consider a 1hr candle, now if you used a 15m time frame then thats 4 candles of information to make up your 1hr candle wheras it's only 2x 30m candles....so the question really is...do the 30m candles add anything meaningful in the observation of the price action on the 1hr time frame!
cheers
Gob00st
Member
- Messages
- 74
- Likes
- 2
Hi Charlton,
Thank you very much for your informative reply, it provide me a good frame to test my learning re Iraj's trading theories 👍
When you mentioned strong/weak stock in your reply , do you referr to them as fundamentally strong in that period or just price action strong in that day(like gap up /gap down)?
I don't quite get this bit when you said "you cannot compare these things directly because obviously the absolute moves in $INDU and each stock are price dependent, so you need to look at how far each has moved compared to the volatility of the stock or index. "
Are you suggesting I compare the volatility of each stock I monitoring as well as compare each stock's volatility to INUD's volatility? If so how? By comparing the ATR number of those or there is some other methodology ?
I am really interested in stock valuation, it's a shame that I couldn't find the recording for that particular webinar. I have heard about FINVIZ.COM before for FA, but I never actually used it seriously to be honest as I know I am not at FA/don't know how to use it properly. Charlton ,Could you guide me through stock evaluation ?
Many Thanks
Albert
I think your analysis was pretty much spot on. Iraj used to emphasise 10 min as being the most important timeframe. Those below it are used for entry/exit and those above it for general market direction. One of the things you can do with Tradestation is to set up a radar screen where you put the MACCI on each row, but each one is set with a different timeframe, so you could have, say, 1,2,3,4,5,6 etc down to say 60. This makes it easy to see whether timeframes are lining up as overbought.oversold across several TFs at a glance. This kinda helps with the point made by counter_violent, because rather than concentrate on the values of single TFs you get an overall feel for whats happening in the longer term, mid term and short term.
The next thing you might want to look at is to compare what is happening to MACCI, $INDU and various stocks at the same time.
The theories that Iraj expounded here were based upon a multi-timeframe top down approach, whereby certain stocks exhibited characteristics that made them weak or strong i.e. they moved more (in relative terms) than the market ($INDU) did within a particular period. The idea is that if they were stronger than the market and the market was going up, then even if the market turned down there would be a "delay" in the strong stock's reaction. Also if the market continued upwards the strong stocks would move more.
So you could test this out by comparing the movements as I say. You cannot compare these things directly because obviously the absolute moves in $INDU and each stock are price dependent, so you need to look at how far each has moved compared to the volatility of the stock or index.
There are posts within the TT thread that explain how to find strong/weak stocks or you could choose some using a screener like FINVIZ.COM. This has a nice heat-map that colours sectors and stocks accordingly.
So if you picked some of these and look at movements of $INDU, the values of MACCI and the movements of your stock selection, you would be able to see when and if MACCI can be used to help you trade the stocks. Also to what extent can the oscillation of MACCI during periods of consolidation act as a "predictor" of when a trade entry or exit can be made and which timeframes are best for this.
Basically by asking "Mr Market" this i.e. would you have made a profit on your, say, Apple trade consistently, you will be able to establish where it is likely to be useful in the future. Going back to your openining question on this thread, the market will tell you if you have learned Iraj's strategies correctly and if they prove true.
Charlton
Gob00st
Member
- Messages
- 74
- Likes
- 2
Hi Paul,
Thanks for the tip. Yes, I think by doing basket trade, Iraj reduced his risk further via diversification by position sizing according to stock's own ATR.
But when doing basket trade, are you referring to swing trade with FA or just day trade with price action(or FA)?
Cheers,
Albert
Thanks for the tip. Yes, I think by doing basket trade, Iraj reduced his risk further via diversification by position sizing according to stock's own ATR.
But when doing basket trade, are you referring to swing trade with FA or just day trade with price action(or FA)?
Cheers,
Albert
Another key factor was that he basket traded with position sizing of each stock in the basket relative to its own volatility. That meant that overall he almost always made a profit because if, for example, INDU was going down then overall the basket of weak stocks would go down as well even if one or two went up.
Paul
Trader333
Moderator
- Messages
- 8,766
- Likes
- 1,030
But when doing basket trade, are you referring to swing trade with FA or just day trade with price action(or FA)?
I was referring to day-trading. What Iraj did was to have a number of stocks that on any give day would be used. As an example lets say the Dow is showing strength then Iraj would have maybe 8 stocks that would be showing relative strength stronger than the Dow. When he got a signal to go Long he would trade all 8 at once with different position sizes based on their volatility. Some may make a loss but overall the basket would almost always make profit. He had got this automated so he didn't need to manually place the orders.
Paul
Read this threadHi Charlton,
Thank you very much for your informative reply, it provide me a good frame to test my learning re Iraj's trading theories 👍
When you mentioned strong/weak stock in your reply , do you referr to them as fundamentally strong in that period or just price action strong in that day(like gap up /gap down)?
http://www.trade2win.com/boards/tec...ify-them-real-time-down-loadable-code-12.html
and do read it all, because there is clarfication as the thread goes on including details on changing data compression and also some screen prints on FINVIZ showing how to idenfity strong and weak stocks as a pre-filter.
For Finviz settings use the following screen prints
http://www.trade2win.com/boards/tec...y-trading-grey1-second-leg-14.html#post443799
All I am saying is that you cannot compare the absolute price movement for each stock to the absolute price movement in $INDU during the session or over x period of time. What you really want to look at is the movement in terms of ATR. So if $INDU moves up by 1 ATR what is the movement in terms of ATR of, say APPLE. Has it moved more in relative terms. This is what the Iraj N min change effectively does, and then you rank everything by the ATR column. A higher ATR above the $INDU row means stronger and a lower ATR below the $INDU row means weaker.I don't quite get this bit when you said "you cannot compare these things directly because obviously the absolute moves in $INDU and each stock are price dependent, so you need to look at how far each has moved compared to the volatility of the stock or index. "
Are you suggesting I compare the volatility of each stock I monitoring as well as compare each stock's volatility to INUD's volatility? If so how? By comparing the ATR number of those or there is some other methodology ?
The period over which you are measuring this is up to you. If you were, say swing trading you might want this indicator on a daily radar screen. For daytrading you would probably use a 10 min interval.
I am really interested in stock valuation, it's a shame that I couldn't find the recording for that particular webinar. I have heard about FINVIZ.COM before for FA, but I never actually used it seriously to be honest as I know I am not at FA/don't know how to use it properly. Charlton ,Could you guide me through stock evaluation ?
Many Thanks
Albert
I don't know if the files are still there or whether they cover what you want but here is a link for where they used to be.
http://www.trade2win.com/boards/tec...-seminar-files-now-rapidshare-except-feb.html
Stock evaluation is a hugh subject and if you really want to get into it there is masses of material
e.g. http://pages.stern.nyu.edu/~adamodar/
http://pages.stern.nyu.edu/~adamodar/New_Home_Page/webcasteqspr08.htm
But this type of stuff is really for long term trading and you don't really need it for daytrading.
Charlton
Gob00st
Member
- Messages
- 74
- Likes
- 2
Hi Paul,
Thanks for the clarification 👍
I think Iraj did mention that automated/Mechanical trading system is the future of trading :idea:
But do you know what kind of trade Iraj's automated trading system is doing ?
Scalping , day-trading or swing trading? I don't think it would be any position trading though 🙂
If his automated system is doing scalping/day trade, then do you know how Iraj choose those stocks that could be used any given day ? (Presumably those stocks should have enough average daily volume & volatility ?)
And had Iraj shared this stock list for us ? If yes, could you point that out please? Or I need to get this list my self by finviz screener?
If his automated system is doing swing trade, did he choose this stock candidates via FA (website like finviz screener or calculating by CAPM )?
Many Thanks
Albert
I was referring to day-trading. What Iraj did was to have a number of stocks that on any give day would be used. As an example lets say the Dow is showing strength then Iraj would have maybe 8 stocks that would be showing relative strength stronger than the Dow. When he got a signal to go Long he would trade all 8 at once with different position sizes based on their volatility. Some may make a loss but overall the basket would almost always make profit. He had got this automated so he didn't need to manually place the orders.
Paul
Last edited:
Gob00st
Member
- Messages
- 74
- Likes
- 2
Read this thread
http://www.trade2win.com/boards/tec...ify-them-real-time-down-loadable-code-12.html
and do read it all, because there is clarfication as the thread goes on including details on changing data compression and also some screen prints on FINVIZ showing how to idenfity strong and weak stocks as a pre-filter.
For Finviz settings use the following screen prints
http://www.trade2win.com/boards/tec...y-trading-grey1-second-leg-14.html#post443799
All I am saying is that you cannot compare the absolute price movement for each stock to the absolute price movement in $INDU during the session or over x period of time. What you really want to look at is the movement in terms of ATR. So if $INDU moves up by 1 ATR what is the movement in terms of ATR of, say APPLE. Has it moved more in relative terms. This is what the Iraj N min change effectively does, and then you rank everything by the ATR column. A higher ATR above the $INDU row means stronger and a lower ATR below the $INDU row means weaker.
The period over which you are measuring this is up to you. If you were, say swing trading you might want this indicator on a daily radar screen. For daytrading you would probably use a 10 min interval.
I don't know if the files are still there or whether they cover what you want but here is a link for where they used to be.
http://www.trade2win.com/boards/tec...-seminar-files-now-rapidshare-except-feb.html
Stock evaluation is a hugh subject and if you really want to get into it there is masses of material
e.g. http://pages.stern.nyu.edu/~adamodar/
http://pages.stern.nyu.edu/~adamodar/New_Home_Page/webcasteqspr08.htm
But this type of stuff is really for long term trading and you don't really need it for daytrading.
Charlton
Hi Charlton,
Thank you very much for pointing out those valuable links for me, really appreciate it 👍
I think it will took me a while to go through those interesting discussion.
But how do we use those strong or weak stocks once we got them via FINVIZ or even CAPM? I mean do you use them for swing trade mainly ? or could be used for day-trade as well? And do you actually use FINVIZ or CAPM as a practical vehicle for FA?
Thanks for those fantastic NYU links, its something I have been looking for :clap: I think I will go through them when I got time .
Albert
They would be good candidates for swing trading, but equally you could feed them into your radar screen containing the Iraj N min change and a row for $INDU. Their relative strength, as I explained in an earlier post, would show how they are currently performing during the current session and hence you would be sorting them into a few potential candidates for daytradingHi Charlton,
Thank you very much for pointing out those valuable links for me, really appreciate it 👍
I think it will took me a while to go through those interesting discussion.
But how do we use those strong or weak stocks once we got them via FINVIZ or even CAPM? I mean do you use them for swing trade mainly ? or could be used for day-trade as well? And do you actually use FINVIZ or CAPM as a practical vehicle for FA?
Thanks for those fantastic NYU links, its something I have been looking for :clap: I think I will go through them when I got time .
Albert
It's not an exact science so it is best to try it out on a SIM account first to see how the stronger and weaker stocks move compared to market movement,
What you are doing is reducing risk by lining up more things in your favour.
Charlton
It's good to see a bit of activity on technical trader once again.
On the topic of stock screening (for swing trading) , in my work I have found that one of the more useful metrics is the % by which a stock exceeded or failed to meet analysts estimates on the most recent earnings release. Of course this doesn't mean buy or short on the stock on the day of release, but does have some edge in predicting future strength or weakness.
I believe Iraj mentioned this somewhere.
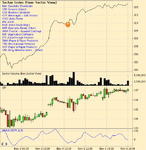
To illustrate the importance of what Charlton is saying about strong and weak stocks, attached are charts of unweighted indices of a group of strong stocks and a group a weak stocks. Also plotted on the charts is the SPY. The stocks were automatically selected from my list of strong stocks and list of weak stocks (about 100 of each). The screening date/time is shown by the "!" icon on the chart. The screen date/time corresponds to a highish MACCI for weak stocks and a lowish MACCI for strong stocks. The strong stocks are up ~4% beating the index by ~3% and the weak stocks are down about 1%, beating index by ~2%.
The screen to select (from my already preselected universes of strong and weak) was a 35bar sharpe ratio on 30 min data, but a simple ROC would probably do as well.
There is no "future knowledge" in these screens. I do not use Iraj's TS code or screens or FINVIZ, but the principles are just the same.
Attachments
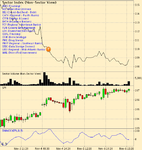
It has occurred to me that the above two charts might be a little misleading under some market conditions.
I would not like to give the impression to anybody fairly new to all this that you can just select a bunch of stocks to for example short, wait for say an overbought condition on 60min MACCI and automatically make money. If the broad market is on a real tear as for example coming off the March lows, shorting anything can get you into trouble very quickly. An appreciation of how strongly the broad market is trending is very important, but that is a another large topic in it's own right.
I would not like to give the impression to anybody fairly new to all this that you can just select a bunch of stocks to for example short, wait for say an overbought condition on 60min MACCI and automatically make money. If the broad market is on a real tear as for example coming off the March lows, shorting anything can get you into trouble very quickly. An appreciation of how strongly the broad market is trending is very important, but that is a another large topic in it's own right.
Similar threads
- Replies
- 4
- Views
- 1K
- Replies
- 108
- Views
- 18K
- Replies
- 44
- Views
- 7K
- Replies
- 0
- Views
- 3K