wsjalerts13
Newbie
- Messages
- 9
- Likes
- 0
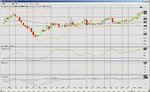
Hey Kool,
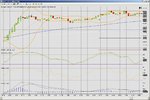
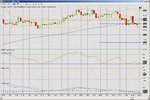
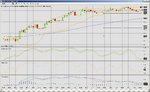
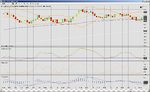
Can you please demo/interpret price projection from the attached chart, I am finding it difficult to project any price from it.
Thanks,
WS.
Can you please demo/interpret price projection from the attached chart, I am finding it difficult to project any price from it.
Thanks,
WS.
Attachments
Last edited:
