You are using an out of date browser. It may not display this or other websites correctly.
You should upgrade or use an alternative browser.
You should upgrade or use an alternative browser.
natureboy
Established member
- Messages
- 770
- Likes
- 2
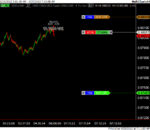
Strength meter confirming short trade USDCAD.. lags terribly.. but in a way can provide leading indication too. Any confirmation by definition is lagging.. or concurrent
It can lead by relative position of the currency lines - a high line may be more apt to turn down than continue
It can lead by relative position of the currency lines - a high line may be more apt to turn down than continue
Last edited:
natureboy
Established member
- Messages
- 770
- Likes
- 2
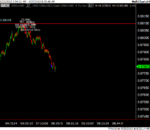
USDCAD has prior support at 0.9782.. friggin support levels today. first the euro, now this..
I may take profits there.. my trailing exit says stay in until trailed out, unless i have a swing ratio target. let me check that.. typically i'd have all this done already..
I may take profits there.. my trailing exit says stay in until trailed out, unless i have a swing ratio target. let me check that.. typically i'd have all this done already..
natureboy
Established member
- Messages
- 770
- Likes
- 2
One more thing. Rather large W10 on the EURUSD. man, i wasn't even trying to trade the bull run today! Just looking for other things. That's the problem with having a bias - i've been looking for EURUSD to get down to 1.2795 (which may, may not happen, of course).
For now, there is a W10, similar to a Butterfly, on the chart. I'm not trading it today, as my personal life needs me. However, there is a time target at noon EST. A trend back down may start near then, may not. Following through similar retracement logic as i've detailed in this thread should help to manage the risk on it if anyone wants to work with that one.
Peace and Profits

wackypete2
Legendary member
- Messages
- 10,211
- Likes
- 2,058
these patterns happen all the time. Maybe for some, they wouldn't want to skip trades. I feel a little more cautious than i used to. it can be so easy to lose money, and i'd rather lose opportunity. there's always another trade....
Well said 👍
Quite the journal by the way.
Lot of range trading in the currencies in recent times. I like to play false breakouts and fade some patterns during these periods.
Peter
natureboy
Established member
- Messages
- 770
- Likes
- 2
Well said 👍
Grazie - perennial market wisdom, passed down by the elders. Keeping the good trading principles up front in the mind helps me.. Good to hit refresh with the basic truths, and to think about them
Quite the journal by the way.
Why do you say that?
I want to drum up some interest in these indicators, figured this was a good way to do it. And i have a view on 'everyone starting to trade' a particular way... i think in this case it reinforces the price action expected. Notice how when it comes to Fibonacci retracements, people say 'oh those work b/c everyone knows about them', yet the same people might be the ones saying 'when everyone starts trading a system, the system is doomed' ... does that make any sense? Not to me.. More money selling or buying at a price, the more effect on price action, generally. People will have different exits anyhow.
Lot of range trading in the currencies in recent times. I like to play false breakouts and fade some patterns during these periods.
Truth! - Volatility has made it way more challenging for the type of approach i like to use - trend style - sometimes even on small timeframes i'd still be building a position right up to when the market reversed its little trend, hit the trailing stop +/- 0.25R.. lousy. Definitely better to be aware of the Big Picture and adjust trading style.
What patterns do you fade? Triangles? Or bar/candle type? You do mean chart patterns, right? B/c of course that's the whole other area of Objective Pattern study is statistically-discovered, multivariable patterns. That can be great for the probability backdrop in which to use these M&W/ABCD Swing Patterns.
I appreciate the feedback Peter,
Good Trading, and may you find a duffle bag full of money on the sidewalk,
(really though, spot me some if you do)
Michael Gould
wackypete2
Legendary member
- Messages
- 10,211
- Likes
- 2,058
What patterns do you fade? Triangles? Or bar/candle type? You do mean chart patterns, right? B/c of course that's the whole other area of Objective Pattern study is statistically-discovered, multivariable patterns. That can be great for the probability backdrop in which to use these M&W/ABCD Swing Patterns.
I don't bother much with candle patterns. I like triangles and rising or falling channels. The way I fade them is when I see a pattern on a 5m or 15m timeframe that has a breakout against the 1 hour trend then I fade it.
Peter
natureboy
Established member
- Messages
- 770
- Likes
- 2
I don't bother much with candle patterns. I like triangles and rising or falling channels. The way I fade them is when I see a pattern on a 5m or 15m timeframe that has a breakout against the 1 hour trend then I fade it.
Peter
Gotcha. I see how that could work. i'll check that out 😎
natureboy
Established member
- Messages
- 770
- Likes
- 2
Bullish above 1.6157, targeting 1.6250 area on GPBUSD. No releases this morning, so one component i look for - time event - is not here.
--
Peter - do you ID those patterns manually or do you have a chart pattern indicator? That could be another thing to design (i'd like to make practical indicators for people)
--
Peter - do you ID those patterns manually or do you have a chart pattern indicator? That could be another thing to design (i'd like to make practical indicators for people)
natureboy
Established member
- Messages
- 770
- Likes
- 2
I need to start advertising my site. Some guys have their URL on every post..
Patterns & Forms | Objective Pattern Analysis – Chart Pattern Recognition Indicators – Pattern Trading
Does anyone on T2W even use MultiCharts or TradeStation? haha
Patterns & Forms | Objective Pattern Analysis – Chart Pattern Recognition Indicators – Pattern Trading
Does anyone on T2W even use MultiCharts or TradeStation? haha
natureboy
Established member
- Messages
- 770
- Likes
- 2
GBPUSD bullish above 1.6162
If the hourly pattern 'fails' - by my definition this means a 50% retracement or less - a downtrend is likely. If price get back below that hourly pattern D, 1.6148, coupled with the Daily resistance, downtrend likely
If the hourly pattern 'fails' - by my definition this means a 50% retracement or less - a downtrend is likely. If price get back below that hourly pattern D, 1.6148, coupled with the Daily resistance, downtrend likely
Last edited:
Similar threads
- Replies
- 35
- Views
- 10K
- Replies
- 75
- Views
- 18K


