Hi All,
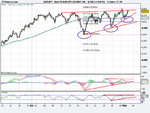
Right back at it. See attached the AUD/JPY 4H and Daily charts. It's an ascending triangle with 89SMA plotted on chart.
5 Step methodology is below:
1. Identified a pattern in development on AUD/JPY. It's an ascending triangle / channel with possible breakout in either direction.
2. Recent S/R's also plotted on chart. Looks like 8755 region has been a major resistance, throwing price back below 89SMA quite a few times. This makes it a very good candidate for breakout. 8548 level was previous support, broke once around 16 April but quickly came back above and then held firmly around 27 April. Overall, the instrument is showing bearish character but could also be coiling for a massive breakout. Plus, the price has been making new highs around fib numbers from previous swing high/lows (circled).
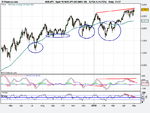
3. On daily chart, the price breached 89MA in an uptrend four times. Each time, it was deeper / longer than before (circled), however the price then continued in the direction of the trend. Last time the breaches were around Jul, Sep, Nov 2009 and Feb 2010 (roughly 2 months) and we are in May now. That's bearish on higher T/F.
4. Price is in the region of 0 and 23.60% retracement from previous swing high(arnd 30 April) and swing low (arnd 19 April). RSI/MACD, none of them show divergence to indicate a move on either side (on my entry TF, however on Daily the MACD and RSI both show bearish divergence).
5. Regarding risk/reward. I would prefer to enter at the break of previous high/lowcandle. (ie, break above 8807 or below 8634 ). The stop loss to be above recent high candle (ie, 8807)
So short entry is 8625 with stop loss at 8810 (padded both by a few pips). Total risk is 185. The daily ATR is also around 118 for past few days. So good.
Target would be double of 185 at least 8255 (which is around 89SMA so not beyond imagination as another breach/break is quite possible). Will be looking to take 1/3rd off and b/e as soon as trade goes in blue around 100 pips.
Alternatively, go long at break of 8810, with similar risk/reward ratio and stop loss reasoning - Just reverse.
In summary:
Long at 8810, s/l: 8625 (risk of 185), 9180 T/P: and more.
Short at 8625 s/l: 8810 (risk of 185), 8255 T/P: and more.