Especulador96
Junior member
- Messages
- 11
- Likes
- 3
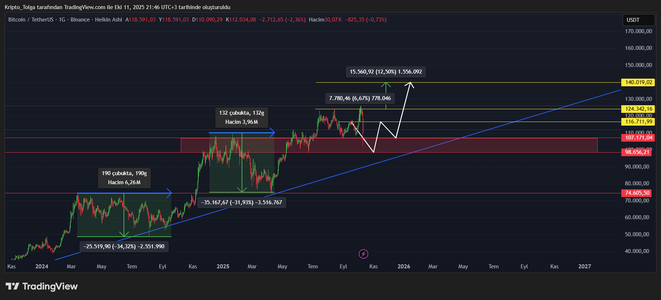
As can be seen in Figure 1.1, BTC exhibits an extremely clear behavioral pattern, showing mean reversion, specifically to the trendline on a weekly chart.
On the other hand, a bearish divergence in the MACD reveals the weakness and lack of interest currently prevailing, reinforcing the hypothesis of a likely correction.
Figure 1.1

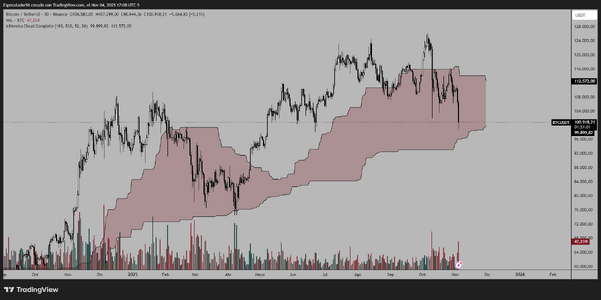
On a daily chart, I show how a modified Ichimoku indicator also displays a behavioral pattern (Figure 1.2). I projected what I believe could happen: I think the price, as it has done before, could rise strongly, perhaps even surpass the previous high, before correcting to $100,000.
Figure 1.2

Is this the end of the bullish cycle?
USDT Dominance (USDT.D)
USDT dominance (USDT.D) is an indicator that measures the percentage of Tether’s market capitalization relative to the total market capitalization of the entire cryptocurrency market. This indicator is fundamental because it provides a relative figure that, unlike absolute market capitalization, offers context to compare USDT’s influence within the broader ecosystem.
The most conventional and widely accepted interpretation of USDT dominance is that it maintains an inverse correlation with the price of volatile crypto assets, particularly Bitcoin (BTC). When investors experience fear or uncertainty, they tend to sell their riskier assets (like BTC) to move their capital into a safe haven that retains its value. USDT, with its dollar peg, is the quintessential destination for this capital. Therefore, an increase in USDT dominance is commonly associated with a drop in BTC’s price and bearish market sentiment. The USDT.D chart moves in the opposite direction to the price charts of major assets, acting as a barometer of risk aversion.
What does USDT dominance indicate?
As can be seen in Figure 1.3 on a weekly USDT.D chart, we are witnessing the formation of a triple bottom, a classic and highly effective pattern in the right context. If, as this reading suggests, dominance increases, it is undoubtedly likely that BTC will reach $100,000, in alignment with our previous analysis.
Figure 1.3

Will BTC consolidate and continue rising?
It is most likely that USDT dominance will continue to rise once the triple bottom formation is fully formed, which would align with the end of BTC’s bullish cycle. A deep correction could cause BTC to lose up to 50% of its value.
On the other hand, a bearish divergence in the MACD reveals the weakness and lack of interest currently prevailing, reinforcing the hypothesis of a likely correction.
Figure 1.1
On a daily chart, I show how a modified Ichimoku indicator also displays a behavioral pattern (Figure 1.2). I projected what I believe could happen: I think the price, as it has done before, could rise strongly, perhaps even surpass the previous high, before correcting to $100,000.
Figure 1.2
Is this the end of the bullish cycle?
USDT Dominance (USDT.D)
USDT dominance (USDT.D) is an indicator that measures the percentage of Tether’s market capitalization relative to the total market capitalization of the entire cryptocurrency market. This indicator is fundamental because it provides a relative figure that, unlike absolute market capitalization, offers context to compare USDT’s influence within the broader ecosystem.
The most conventional and widely accepted interpretation of USDT dominance is that it maintains an inverse correlation with the price of volatile crypto assets, particularly Bitcoin (BTC). When investors experience fear or uncertainty, they tend to sell their riskier assets (like BTC) to move their capital into a safe haven that retains its value. USDT, with its dollar peg, is the quintessential destination for this capital. Therefore, an increase in USDT dominance is commonly associated with a drop in BTC’s price and bearish market sentiment. The USDT.D chart moves in the opposite direction to the price charts of major assets, acting as a barometer of risk aversion.
What does USDT dominance indicate?
As can be seen in Figure 1.3 on a weekly USDT.D chart, we are witnessing the formation of a triple bottom, a classic and highly effective pattern in the right context. If, as this reading suggests, dominance increases, it is undoubtedly likely that BTC will reach $100,000, in alignment with our previous analysis.
Figure 1.3
Will BTC consolidate and continue rising?
It is most likely that USDT dominance will continue to rise once the triple bottom formation is fully formed, which would align with the end of BTC’s bullish cycle. A deep correction could cause BTC to lose up to 50% of its value.