Intra-minute whipsawing on candlestick chart

asimpleplan

Member
Messages
63
Likes
3
Hi,

Can anyone enlighten me on whipsawing in the intra-minute range on a candlestick chart? On a 1 minute LINE chart, the only information is the closing price ahead of the previous minute's close but of course that doesn't tell the whole story about the whipsawing prices traded in that minute.

So, let's take, for example, the candlestick at 10.01, which closes slightly below the previous close at 10.00.

The whole range is:
(HI)1.12902/(LO)1.2886
(OPEN)1.12901/(CLOSE)1.12982

So, after the price opens, is the assumption that the price whipsaws to the high first and then to the low before closing?

Or, does one assume the price whipsaws ANYWHERE between that range within the minute before closing?

Obviously, in this case (a RED candlestick), common sense dictates that the high would occur soon after the open before whipsawing down and establishing the closing price.

Sorry to labour the point but I need to be certain. Thanks.

GyG88MpE
 
I don't think you can make any assumptions about price action within a 1 minute candle there's just too much noise.
 
First, if you want to know what's going on intra-minute, you're going to have to look at the intra-minute activity.

Second, price movement is continuous. Therefore there is no "close" but only a movement from one price point to another. The market couldn't care less how you segment these moves. Therefore, if you want to understand what price is doing and why, look at the buying and selling "waves". You'll quickly learn that there is no such thing as "noise".
 
Can anyone enlighten me on whipsawing in the intra-minute range on a candlestick chart? On a 1 minute LINE chart, the only information is the closing price ahead of the previous minute's close but of course that doesn't tell the whole story about the whipsawing prices traded in that minute.
Hi asimpleplan,
Dbp commented that if you want to know what's going on intra-minute, you're going to have to look at the intra-minute activity. Check out the link he provided (and the one in his signature) as he is one of the best - if not the best - forum member to advise you on this. I suggest you switch to a standard candlestick chart (or bar chart), as a Heikin-Ashi chart probably isn't the best one to use. The reason being that it's designed to filter out what cbrads referred to as 'noise'. It averages out price activity to provide what some regard as a simpler view of the landscape. Whether it's a better view and makes life easier, or whether it's a restricted view that make life harder - is for you to decide.

"Obviously, in this case (a RED candlestick), common sense dictates that the high would occur soon after the open before whipsawing down and establishing the closing price." This is easy to prove - or not - for yourself. And you need to do it yourself and not just accept what someone else tells you. Open up a 10 or 15 minute chart and look at the 1 minute candles that collectively make up a single 10 minute candle. Sometimes, your 'common sense' assumption will be correct - but not always. If you study the phenomena enough, you'll be able to draw up the conditions when it's most likely to occur - or not as the case may be. As a starting point, there's grain of an idea there that could, potentially, be developed into a workable trading plan.
Tim.
 
Thanks for the helpful comments. I'm currently building a scalping strategy. In spite of what the 1 min line chart was telling me, there's clearly more to the story.

Those 5s bars linked to by DBP answer my question. Thx.

I'm still figuring out my trading software (FXCM). I wasn't even aware a 5s time frame was available.

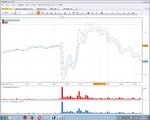
The reason the whipsawing became apparent to me was because when I was trialling the demo, on the 1 min line chart, there was a large trading range not shown on other charts. (see picture). This has invalidated the basic premise of my strategy which was to ride short term trends with tight stops, which would be triggered pretty much instantly in the next whipsaw.

I'm reluctant to post more information about my plan but essentially it's a pretty basic scalping strategy and will be pretty obvious to those with more experience.

Whilst my initial premise was wrong, I don't think I need to abandon it completely.

Hopefully, now it's just a question of backtesting and optimisation for me.
 

Attachments

  • 1minChart3lines.jpg
    1minChart3lines.jpg
    371.4 KB · Views: 268
Last edited:
Those 5s bars linked to by DBP answer my question. Thx.

You're welcome. Keep in mind, though, that you're competing with professionals. They don't care about your candles and your indicators and most of them don't even care about your charts. If you don't know what they're doing and where and why, you could waste years just trying to break even. Is that really what you want to do?
 
Sure, that's why I'm trying to set very specific rules for entry into trades.

I'm not trying to discourage you, but it doesn't matter. If you're doing this for fun, then the phrase "trade only with money you can afford to lose" takes on special meaning as you are virtually guaranteed to lose it. If you're serious, and you want to focus on scalping for some reason, you're going to require a datafeed that you most likely can't afford along with an extremely robust platform. You're also going to have to arrange for commission discounts in order to avoid giving back practically everything you make, if anything, in trading costs.

I suggest you think very carefully about exactly what it is you want. Then you can begin exploring ways of getting it.

Good luck to you in any case.
 
Hi,

Can anyone enlighten me on whipsawing in the intra-minute range on a candlestick chart? On a 1 minute LINE chart, the only information is the closing price ahead of the previous minute's close but of course that doesn't tell the whole story about the whipsawing prices traded in that minute.

So, let's take, for example, the candlestick at 10.01, which closes slightly below the previous close at 10.00.

The whole range is:
(HI)1.12902/(LO)1.2886
(OPEN)1.12901/(CLOSE)1.12982

So, after the price opens, is the assumption that the price whipsaws to the high first and then to the low before closing?

Or, does one assume the price whipsaws ANYWHERE between that range within the minute before closing?

Obviously, in this case (a RED candlestick), common sense dictates that the high would occur soon after the open before whipsawing down and establishing the closing price.

Sorry to labour the point but I need to be certain. Thanks.

GyG88MpE

To see how price behaves on 1M chart use 10 second chart or one second (which unfortunately are not available at MT4, smallest is 1Min).
In MT4 tick data will help, though I don't know if you can expand it to full chart.
 
Maybe I'm deluded?

I suppose I've convinced myself I can trade successfully based on technical analysis and strict rules, but perhaps I'm wrong - you seem to think so. After, my tinkering with a demo account, I'm learning the hard way. At least I've not committed any money yet.

I approached a trading firm here in London and explained the basic premise of my very amateurish plan. They were trying to get me to sign on to their course (of course). After struggling with the demo software, I realised whatever plan I had needs work. So, I'm working on a presentation to show them, which hopefully they can work with and I can develop. Their charges are not unreasonable.

I'm going to keep chipping away at this until I'm sure that I've at least properly asked the question about what it takes to be a successful day trader; I haven't asked that question fully yet because whatever 'grain' of a plan I have clearly has holes in it, which this thread highlights.
 
Another thing, it seems that what I thought was a scalping strategy is now developing more into a swing strategy.
 
Another thing, it seems that what I thought was a scalping strategy is now developing more into a swing strategy.
Hi asimpleplan,
Given what dbp has said about scalping (which I agree with 100%), developing an intra day swing strategy is a much better plan!
(y)

If you're proposing to use indicators, it's essential that you use the right ones for the right reasons. I've emphasised 'right' because there's no universal agreement about what this means. Like many things in trading, it's personal and what's right for you will be a disaster for the next person. If you wish to pursue this further, check out this Sticky: Essentials Of Technical Analysis. If you don't want to read the whole thing, scroll down to the heading: 'Indicators and the Mechanics of TA' in post #2. Whilst on the subject, I notice one of the indicators on your chart is volume. Many traders will tell you that volume in the spot forex market is of questionable value as forex isn't traded through a central exchange. In other words, it can be very misleading. Combine this with the volumes (sorry, couldn't resist) of rubbish written about it and your task in using it profitably becomes harder still. Having said all that, if you find it helpful - that's great - don't let me put you off!

With regard to courses, before putting your hand in your pocket be sure to read, mark, learn and inwardly digest these two FAQs:
Can You Recommend a Mentor, Coach or Trading Course?
How Can I Distinguish Between Scams and Reputable Vendors?
Tim.
 
Once again, thanks for all the advice. I didn't mean anything by the presence of the volume data in the chart - it just happened to be in the screenshot.

Anyway, plenty of reading for me there in those links in the week ahead. I'll keep you posted.
 
Top