Index King In Da' House !

hmmm a very strange state of affairs,

it all goes to show people like notice of what is happening ,i always new that at some point hugo would want to charge for his system,you don't run web sites and put adverts in trade papers for the good of your health. well its all gone pear shaped now, like so many things in life.

what was the other web site that hugo used to post on, and was it along the same lines as this one ?
 
smilies-24522.png
 
BigB,

Cheers for the above...so the formula IK has been using is:

6 days ago DOW close minus 6 days ago FTSE close plus todays FTSE close.

I'm gonna check a few numbers here and see if it works.

If it does ..it shows old HUGO up to be a right chimp!
 
Tactical trader was one other website. What trade papers was he advertising in? As he said that most of his visitors were from outside the UK, I wonder if he has been advertising on other boards? But as he seems to be making up stories as he goes along to cover his previous statements, perhaps that bit wasn't correct.
 
Nice one BigB!
I was one day out with my DOW and Ftse figs.

FYI the mkt map is pointing for a sell @ 9750. LOL!

Freedom is great!
 
I have backtested it over the past 3 yrs, and the results aren't bad (despite some massive losses along the way). Unless IK modifies his strategy recent results are the same as what is posted on the stats page of the site, but further back the 2 diverge, and on one occassion a negative result is posted on the site as a positive one (exact same value, sign reversed).

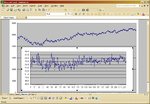
Over the past 3 yrs, after taking into account a 25pt spread per trade, the system has returned 6705 pts. The biggest gain was 800pts (around Sep 11), the biggest loss was 500pts. My calculations may have faltered along the way (had to work out profit manually). Thanks to bigbusiness and citroen for posting the formula (it's actually 7 days back you need to use)

I would like to post the spreadsheet on here. Is it ok to do this? Alternatively, whoever wants it can send me a private msg with their email, and I will email it out to them this evening when I am back home (BB will send to you as a matter of course)
 
Very strange indeed.

If he has a system that works and was willing to set up subscription service for others why would he want to take up a new job.

With all the cash he said he was receiving he could spend more time improving the system and relax on a nice beach every now and then as some of the top traders of this site have been doing.

Bigbusiness are you going to take over this thread now!!
 
Geckotime

I'm sure there'll be no problem with you posting your spreadsheet here...

but if you can't then, please email it to me....

cheers
 
Here's a TradeStation report for a slightly different strategy, based on a more conventional approach to generating signals. Results are in terms of $1 per point.

This report assumes a slippage of 20pts (ie when entering a trade, you immediately lose 20 pts of the difference between the
official FTSE close and the official DOW close).

There is a stop-loss set at 350pts for this particular set of results.
Because of a limitation in TS2000i processing daily data, you will see trades that exceed this stop loss - these are trades where the stop loss amount has been exceeded in a single day's movements. How you would deal with these in practice is a good question. One would have to have a live chart of the DOW-FTSE difference going and exit both sides of the trade when the stop-loss amount is exceeded. This limitation may also have skewed the results - for better or worse, I cannot tell. It would be a manual job to work it out.

Anyway, in general it shows that there probably several valid approaches to developing a system using FTSE-DOW differences.

I have posted this as an Excel 95 workbook. Let me know if any of you have problems viewing it.

Paul
 

Attachments

  • ik01.xls
    319 KB · Views: 272
Thanks for doing the hard work Gecko. So it averages 2,200 points per year, not the 7,000 plus from the stats page.

It's probably best to make the spreadsheet available and then everyone can do what ever they like with it. Not sure if we are allowed to do this, perhaps a moderator could give some advice or one of those legal people that lurks this thread.
 
There was a very interesting chart comparing ftse/dow differences in points AND percentage put up by, i think it was either wideboy or bigboy, or maybe just boy.... can't remember for sure who it was , and apologies in advance ig i've misquoted anybody...
but it was a very interesting chart, and if the same person can put up an updated chart, then it would certainly be worth discussing here, or even elsewhere....(in another thread)
 
Last edited:
Guys,

Any strategy with no stoploss can produce awesome results... you was warned...
 
Aha, here's one I prepared earlier :)

This shows the price difference in the main chart and the subchart shows the difference between FTSE and DOW measured by a %age of DOW.

Wideboy
 

Attachments

  • dowftse.jpg
    dowftse.jpg
    98.7 KB · Views: 377
As Bonsai said earlier, the difference just gets bigger and bigger as the chart clearly shows. Be very wary anyone who 'thinks' the indices will draw closer together after becoming numerically further away than usual! This hasn't been the case yet this year!
However the value of the FTSE does seem to stay within 54-57% of the value of the Dow.
 
Top