I have found the Holy Grail indicator for the Dow Jones - 100% right so far

This chart is for TEAMTRADER as requested. This is the S&P 500 with my ADS Oscillator indicator. As you can see it looks like the indicator is about to cross the zero line back into the "GREEN". This is a "BUY" signal which means that the S&P 500 could be about to make a move to the upside in the short-term. However I would be a little cautious because of the nearly 2% rise today. There could be some profit taking tomorrow.

SmartSelect_20230427_215901_MV Chart 2.jpg
 
The "BUY" signals I gave yesterday for the DOW and S&P 500 turned out to be correct. The DOW went up by 272 points and the S&P 500 went up by 34 points today.
 
Excellent - keep up the signals Batsonar.
:cool::cool:
TEAMTRADER
TEAMTRADER - I have been "back testing" my BATSONAR indicator again which tracks money flow. I have been messing about with the parameters and settings. The results are from the 14th February 2020. There were 198 trades in total. There were 144 winning trades and 54 losing trades. This gives a win rate of 72.73%. The BATSONAR indicator is more of a short-term indicator and predicts the move on the DOW for the next day or next few days.

I have also been back testing my DPO (Detrended Price Oscillator) indicator on a higher setting. The results are from the 4th February 2020. There were 108 trades in total. There were 81 winning trades and 27 winning trades. This gives a win rate of 75%. I think this in the "trading world" is considered a very high win rate. There were half as many signals generated by the DPO indicator than the BATSONAR indicator over the same period of time but some of the wins were massive. The DPO indicator can keep you in the trades longer thus generating more profit over the mid-term. The BATSONAR indicator is more of a short-term indicator while the DPO indicator is more of a mid-term indicator.
 
Last edited:
Different people will trade in different ways but to me the Holy Grail is making a profit every day so I am a supporter of the signals.
Appreciated.
TEAMTRADER
 
Different people will trade in different ways but to me the Holy Grail is making a profit every day so I am a supporter of the signals.
Appreciated.
TEAMTRADER
Can you start posting some of your charts with signals? I would be interested because it might help me to determine if my signals are valid or not. I don't really get a lot of feedback on this thread for some reason except you.
 
Yes, I have differing templates for the type of trade (depending on how much time I have) but I use your 'direction' indicators along with my own and when they all agree it is easy.
There are times when I cannot trade (and these are many) but when I do I will post the entry/exit points.
TEAMTRADER
 
Yes, I have differing templates for the type of trade (depending on how much time I have) but I use your 'direction' indicators along with my own and when they all agree it is easy.
There are times when I cannot trade (and these are many) but when I do I will post the entry/exit points.
TEAMTRADER
This is why I don't like "day trading". I don't like watching charts all day long. I only make trading decisions on the DOW at the end of the day after it has closed to confirm a signal. I prefer higher time frames. I can't get on with "minute" charts. My indicators seem to work better on the daily time frame.
 
This is why I don't like "day trading". I don't like watching charts all day long. I only make trading decisions on the DOW at the end of the day after it has closed to confirm a signal. I prefer higher time frames. I can't get on with "minute" charts. My indicators seem to work better on the daily time frame.
I have a complete aversion to losing money so day trading is the only way that I can trade.
If the fundamental signs/sentiment were linked up to the technical indicators then what an easy job it would be!
Losses are inevitable but even after 25 years of trading I hate losses - as I believe that they are almost always avoidable.
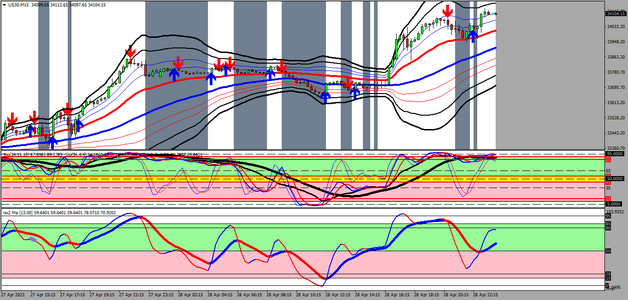
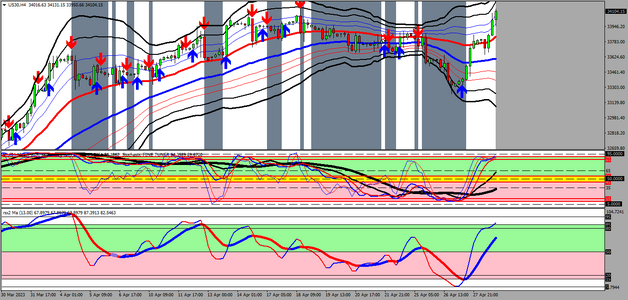
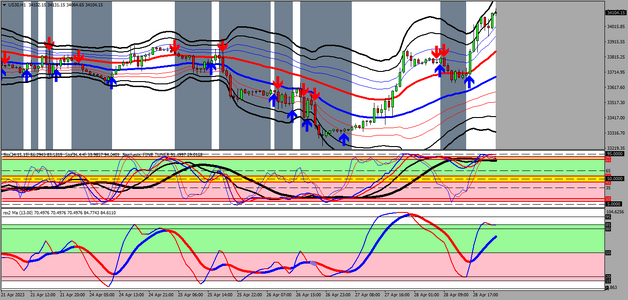
I have attached the 4hr (my signal entry chart) with the 15m chart (the chart I use when I have the time - but the 1m chart is used when I have little time).
The under chart indicators are multiple stochs on the top (longer term in black, shorter term in red/blue) and multiple RSI on the bottom (they give me divergence as well as entry exits when in the white areas).
On chart BBands using smma's (not sma's) and stochastic cross signals (arrows) - the background is when the CCI-13 crosses zero.
Each trader to their own system and NEVER change what works for you. The grass is NEVER greener on the other side of the trading field!
I do appreciate what you are sharing.
TEAMTRADER
PS - I have added the 1hr chart to show divergence so it is likely there is not much left for me in the move upwards on the Dow.
 

Attachments

  • US30M15.png
    US30M15.png
    77.8 KB · Views: 7
  • US30H4.png
    US30H4.png
    82.9 KB · Views: 8
  • US30H1.png
    US30H1.png
    80.5 KB · Views: 8
Last edited:
This is my BATSONAR indicator. As you can see the indicator has crossed the zero line back into the "RED". This is a "SELL" signal. This means that the DOW could be about to make a move to the downside in the short-term. However there is a "Pivot Point" support level (see pink line) at 33,522 which means any downside on the DOW could be limited.

SmartSelect_20230502_212918.jpg
 
TEAMTRADER - The S&P 500 chart, with the same BATSONAR indicator, is giving the same signal as my last post of the DOW chart. That is a "SELL" signal.
 
TEAMTRADER - The "SELL" signal I gave yesterday turned out to be correct and the DOW Jones fell by 270 points today. Also the S&P 500 fell as I also predicted yesterday. I hope you had a happy wedding anniversary.
 
This is my ADS Oscillator. As you can see, it still well in the "RED". There is a potential of more downside to come in the short-term I think. Also as you can see on the chart, the candle has fallen below the "Pivot Point" support level (see pink line) at 33,522. This means that this support level now becomes resistance.

SmartSelect_20230503_212618.jpg
 
Top