Best Thread How To Make Money Trading The Markets.

Good evening, Tim,
Me tease anybody? How could you suggest such a thing? :cheesy:
No, it's a genuine question and who knows, some might find the answers illuminating, though others will already know.
Thank you for setting the ball rolling with your ideas. Let's see if anybody else wishes to stick their head above the ramparts. They are not going to be shot at by me !
This thread is meant to be helpful :)
Take care,
Richard
 
Maybe some people might find it interesting to go off at a tangent sometimes, so here goes.
Would anyone like to explain what the hammer at the extreme right means?
No answer, right or wrong will be laughed at by me.
Go on, have a go.
Richard

Well - without looking at Time & Sales ('cause I can't see ze symbol) it is hard to tell but I would say that it appears to be entirely possible that most of the action on the bar was at the $21.60-ish level but that a single trade at $21.30-ish created what on the surface appears to be a pin/bar.

I would say that this is NOT the price dropping to $21.30 and a bunch of buyers rushing in to push the price back up.

Like I say - hard to tell with out T&S though.
 
I was also going to suggest something similar to Tim - the possibility of a block trade. However, the candle spiked down to a low where there was significant support on the previous retracement, so I would have to say it was a placement of a limit order gone wrong :D

In other words, someone may have decided to place a limit buy order at that price since there was support there, however, they may have initiated a limit sell order accidentally at that price, which immediately got executed because it was lower than the inside ask at the time.

Maybe some people might find it interesting to go off at a tangent sometimes, so here goes.
Would anyone like to explain what the hammer at the extreme right means?
No answer, right or wrong will be laughed at by me.
Go on, have a go.
Richard
 
something to do with a big print going off at the low of that bar, creating a split second 'spike'?
 
Maybe stop hunting by a MM?

Dom

I don't believe that MMs can do that. Sure, they will wiggle the price around in quiet times to find interest which could also be stops.

The buyer/seller with the best bid, always gets the trade, an MM can be buyer/seller when they are best bid. In the abscence of other players, their own bids/asks have to be 'reasonable' (which is a vague concept).

So - in this case, the prescence of other bids would prevent the MM from spiking the price like that and more than likely, so would the rule of them providing a reasonable bid of last resort.

Someone correct me if I am wrong here.

You may be right. So maybe a broker is stop hunting?
 
You may be right. So maybe a broker is stop hunting?

I doubt it, no-one can spike the price like that without dumping stock and absorbing all of the bids.

These people can't just put the price where they want it.
 
All

I found this method requires fast fingers if you have a few positions on at a time, so here's an ELD.

Idea is that you put this strategy on a chart window but disable it. When you are ready to buy, just enable the strategy and it will instantly buy as well as put a stop order at the low of the last bar.

Make sure you test, test, test & make any adjustments you need before running it on your live account please !!

Code:
[IntrabarOrderGeneration = True];
Inputs : QtyOverride(0), AccountSize(25000), RiskPercent(.25), MaxTradeValue(0) ; ;
Vars : intrabarpersist Done(false), intrabarpersist RiskCents(0), intrabarpersist NumShares(0);
if marketposition = 1 or GetPositionQuantity(GetSymbolName, GetAccountID) <> 0 then done = true;
if GetAppInfo( aiRealTimeCalc ) = 1 then begin 
    if done = false then begin
  RiskCents = (Close - Low[1]) + .01;
  NumShares = ((AccountSize / 100) * RiskPercent) / Highest(RiskCents,AvgTrueRange(14)) ;
  if MaxTradeValue <> 0 then NumShares = minlist(NumShares,intportion(MaxTradeValue / Close));
  if QtyOverride <> 0 then NumShares = QtyOverride;
  buy NumShares contract next bar market ; 
 end;
 if NumShares = 0 then NumShares = GetPositionQuantity(GetSymbolName, GetAccountID);
    Sell NumShares contract next bar Low[1] Stop ; 
end ;

Qty Override - number of shares to buy if you don't want the system to calculate
AccountSize -
RiskPercent - Risk per trade (%)
MaxTradeValue - max number of dollars to commit to a trade (total, not risk total)

Enjoy

Hey Pedro01 can you give any guidance on turning your code into an ELD, i know how to import one but not how to create one. Looks like a great automation to Mr. Charts strategy (which i'm attempting to learn). Thanks.
 
I'll give it a couple of days to see if anyone else ventures an explanation, then post what happened.

BXS was a pre-market news story so was on my alert list before market open.
Most people would look at the average daily volume and see it was under 300k and decide to ignore the stock, expecting low range, low volume and low volatility.
There is a distinct probability the stock might behave very differently as a result of the news story; in fact almost like a different stock.
At this time it has already traded in excess of 5.5 million shares, 20 times normal volume !
Personally I don't think or trade the same way as most people or all the books and accepted beliefs/myths/misunderstandings that lead to most people failing.
So far today the market has been in a narrow range, but there are still opportunities.
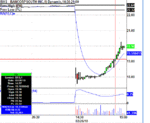
Using the method in this thread, this was my trade for a nice juicy +81c per share.
Richard
 

Attachments

  • 260210BXS.GIF
    260210BXS.GIF
    18.2 KB · Views: 263
I'll give it a couple of days to see if anyone else ventures an explanation, then post what happened.

BXS was a pre-market news story so was on my alert list before market open.
Most people would look at the average daily volume and see it was under 300k and decide to ignore the stock, expecting low range, low volume and low volatility.
There is a distinct probability the stock might behave very differently as a result of the news story; in fact almost like a different stock.
At this time it has already traded in excess of 5.5 million shares, 20 times normal volume !
Personally I don't think or trade the same way as most people or all the books and accepted beliefs/myths/misunderstandings that lead to most people failing.
So far today the market has been in a narrow range, but there are still opportunities.
Using the method in this thread, this was my trade for a nice juicy +81c per share.
Richard

Hi Richard,

I have read your thread with interest, first of all congratulations for your hard and generous work here and apologies if I have missed what I am asking below.

I have some questions about the systems, some of them on the entry point in your system.
In this example, why did you enter at that point and not let's say 2 minutes before, to me it seems an established trend already, however if I have I would probably have been shaken out. Do you have a number of "higher-low" bars for you to decide to enter a trade?

I appreciate that you have said that you like to see a trend established, but the question is perhaps if there is any specific way of identifying the entry point.

Thank you.
 
I suspect that richard saw a level 2 reason to get on the back of this.
And often richard will have been trading something else before noticing the potential of this one.

I am sure he will answer u tho with teh actual reason!


.
 
Maybe some people might find it interesting to go off at a tangent sometimes, so here goes.
Would anyone like to explain what the hammer at the extreme right means?
No answer, right or wrong will be laughed at by me.
Go on, have a go.
Richard

Big sell order going thru.
Or.
The algo's turned off for some reason, so the book thinned out and somone whacked it, before the orders rapidly flowed back, taking it back up.
Or
If you have your chart setting to "all trades", this could be a firm doing a block trade at that price, hence the print.

End of ideas from me!


.
 
Thanks D70, your comment:
"And often richard will have been trading something else before noticing the potential of this one " is correct.

tigretoncio,
When I pick up a stock from scanning it might well have already been trending for a while
HTH

Richard
 
Thanks to everyone who contributed ideas about that question on Feb 25th.
The "spike" was, as several people suggested, a block trade printing off well away from current market price.
Hammers can be deceptive, especially after a down move when people think the way books tell them to, i.e. the hammer represents a sharp fall in the price over the time window of the candle, buyers then rush in and push the price back up again. Although that is sometimes true, sometimes it's nonsense. A block trade going through at a price well below the current price can create a similar looking chart. The lower shadow on the candle may simply be the joining up of the block trade printing off with the body of the candle. In other words, the price immediately before and the price immediately after the block trade might well be the same or within a cent or so. It's the block trade which distorts the interpretation of the candle and is usually not significant.
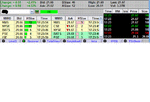
Look at the image on the T&S (black on the right) and you will see the block trade of 26,000 at 21.30, 36c away from the real price action.
This is one reason why I personally find level 2 and T&S to be invaluable SOMETIMES.
Sometimes it's noise, but other times it can tell you what is likely to happen BEFORE the chart, as the chart is a record of trades already done. I think of it as being a third dimension, sometimes of no use, sometimes priceless.
Richard
 

Attachments

  • 250210special#2.GIF
    250210special#2.GIF
    27.9 KB · Views: 207
Thanks to everyone who contributed ideas about that question on Feb 25th.
The "spike" was, as several people suggested, a block trade printing off well away from current market price.
Hammers can be deceptive, especially after a down move when people think the way books tell them to, i.e. the hammer represents a sharp fall in the price over the time window of the candle, buyers then rush in and push the price back up again. Although that is sometimes true, sometimes it's nonsense. A block trade going through at a price well below the current price can create a similar looking chart. The lower shadow on the candle may simply be the joining up of the block trade printing off with the body of the candle. In other words, the price immediately before and the price immediately after the block trade might well be the same or within a cent or so. It's the block trade which distorts the interpretation of the candle and is usually not significant.
Look at the image on the T&S (black on the right) and you will see the block trade of 26,000 at 21.30, 36c away from the real price action.
This is one reason why I personally find level 2 and T&S to be invaluable SOMETIMES.
Sometimes it's noise, but other times it can tell you what is likely to happen BEFORE the chart, as the chart is a record of trades already done. I think of it as being a third dimension, sometimes of no use, sometimes priceless.
Richard

And depending on your charting package, you should be able to turn these prints off (so they dont show and distort the pretty view) . ;)


.
 
something to do with a big print going off at the low of that bar, creating a split second 'spike'?

So was I kind of right?
Either way it doesn't matter because i dont really understand. It was just a guess/.
Never reallyl looked at US stocks.
I think what i meant is that someone putting in a huge limit order in at 21.30 somehow creating a spike. But if you can see it on the 'time+sales' that means it was filled, no?
If so, how can that be? Maybe ill start trading US stocks if i cn just buy something for a 30 cents discount than the current market price!" :)
im clearly confused.
thx
 
D70,
Yes, but leaving some of the options showing can be useful, imv.

morgan,
Block trades are usually done privately off screen between MMs and others.

Richard
 
Top