Best Thread How To Make Money Trading The Markets.

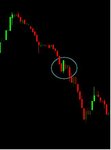
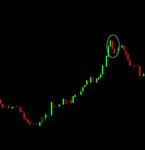
Test this particular method for yourself time and time again in all sorts of markets, trending up, trending down, ranging, grinding up or down. Do that at least 100 times to get an idea of how often it works. Always concentrate first on RISK, not reward; that comes later; it almost takes care of itself.
Look at the worst case risk using my rules and position size accordingly. Even without experience you should find that in a mix of different markets you should get 70%++ wins, the average win size being far in excess of the average loss size. We all improve with experience and you should end up with significantly more than 70%.
If this is the only tool in your armoury, (I use several more), then you MUST be patient and wait for the right set up as repeatedly described. Think of yourself as a sniper who simply lies in wait for the enemy to come to him and doesn't impatiently shoot at shadows.
Richard
 
Hi Richard,

Thanks for your time. when you run a scan, what specifics are you looking for. Must the stock have been trending strongly most of the day. Or will you enter on a pull back or retracement?

Do you scan for a low ATR stock first or see what it looks like after?

Also on the time and sales ( I don't have L2) , do you filter for large orders coming through, would that be an initial sign of movement or just and increase in the flow of orders hitting the book?

Thankyou.

I am looking for a clearly trending stock which has been trending for a while. In other words it might have been range bound initially but is then trending.

I do enter some of my other set ups on retracements. Those are beyond the scope of this thread.

I see what ATR looks like after I've found the trending stock and adjust position size accordingly. However I much prefer stocks where level 2 and T&S are actually readable, sometimes they aren't, sometimes they are. As a rough rule of thumb the lower the ATR the more likely they are to be readable, but that really is a rough and ready guide. I often trade high ATR stocks if I can read level 2 and T&S on them.

How I use level 2 and T&S is beyond the scope of this thread, but large orders don't usually play a significant role as they tend to be broken up in numbers and time to hide them. Block trades can be a little different.

Hope that helps,
Richard

PS Some trades are on stocks which I've chosen for other reasons, not scanning, like the EXM example earlier.
The entry and exit remain the same.


Thanks Richard.

Dont know if this is of any use to you.
I use the paint bar colours on my charts, to see when a candle has actually made a HH-HL or LH-LL. Not all green or red candles are. Only when I see a strong or weak candle will I exit.

Thanks, hope it helps.
 

Attachments

  • Colour Bars.JPG
    Colour Bars.JPG
    9.2 KB · Views: 355
  • Colour Bars 2.JPG
    Colour Bars 2.JPG
    8.8 KB · Views: 327
Hi Richard,

I had a go at you method today. I turned a profit on INTC. Although I think I failed miserabley at your entry and exit criteria. The whole market was trending up this afternoon so I think I just got lucky with this one.

It's hard to find stocks trending in the exact manner you describe, you must have to sift through lots of stocks to find one. Thanks.
 

Attachments

  • INTC Long.JPG
    INTC Long.JPG
    24.5 KB · Views: 412
I read news stories pre-market and also scan. The scans run through the whole market in a couple of seconds then I just click on each one to see the chart. As I said I do other set ups too so I'm looking for all of them.
Richard
 
95% of people just won't follow the rules :)
Richard

LOL! I know self discipline is the hardest skill to master.

Thanks for the tips, they seem to be consolidating/ possible reversal at the moment. Will keep an eye on them.

Cheers Richard

:cheesy:
 
its really not hard to find these stocks, they all show up on yahoo finance market stats when the market opens...

other observation: I think a lot of people use these methods with out understanding why the price/volume behaves like it does. Its a constant battle between Bulls/Bears...Mr. Chart - it would be helpful to explain a little about how the winner dictates the momentum.

(it might be hard to do this without going into detail about t&s & l2) but give it a shot)

I might be a bit out here but here goes....

If the last few candles of your chosen time frame are all the red and generally have lower highs and lower lows then you've got downward momentum as long as they continue this there's selling momentum.

For upward momentum blue candles and higher lows higher highs.
 
Richard

Just a quick question to clarify something if that's ok...

Would you say that with this method you are (nearly) always trading the break of the current Hi/Low of the day?
 
Doesn't that depend on the timeframe you trade in?

I am using this with satisfying success on M5 in conjunction with my own trading style for much, much tighter entries.
 
Richard

Just a quick question to clarify something if that's ok...

Would you say that with this method you are (nearly) always trading the break of the current Hi/Low of the day?

Hello foredog,
Usually but not always. I've kept it like that for this thread as I wanted to provide a simple straightforward method that people could use to make consistent money for themselves.
As I've said before, I use several other methods which also work extremely well.
I do use a variation of this method which takes trades which have not broken the hi/lo.
As I've said to some people who have emailed me about this method (EMAILS ONLY - NO PMS ANSWERED) if 100 people start out using this method 90 - 95 will soon alter it or ignore key requirements - and wreck it.
Hope that helps,
Richard
 
Doesn't that depend on the timeframe you trade in?

I am using this with satisfying success on M5 in conjunction with my own trading style for much, much tighter entries.

shadow,
I'm glad you've found the concept useful and profitable :)
I'm sure you've already figured out why it works.... :)
Richard
 
Hi Richard

Thanks for the answer. I thought that.


I guess it is easier totrade stocks making new hi/lows than looking for retracements somwhere in the middle of the trading range
 
The thing is, foredog, if you have a watch list of moving stocks, you often see the retracements anyway.

Here's a hot stock from this afternoon which fulfilled the requirements for this set up. There haven't been a large number of such hot stock opportunities recently so it's always nice - and very profitable - when they do crop up. All you've got to do is read the news stories pre-market, scan during market hours and use a high probability, low risk, tight position-sized stop loss set up such as the one I've described in this thread.
With this particular one I didn't wait for the usual exit signal as I could see on level 2 T&S that buyers/coverers were beginning to appear and selling pressure was abating.
With slow moving stocks you can sometimes find the exact low or very close to it, with faster moving ones you tend to find the broad zone where the turn around occurs; NOT ALWAYS, but often enough :) Even if you're "wrong" and more selling pressure comes along, you've still made good money :)
This little beauty was a profit of $1.54 per share on the actual fills.
Red X hairs on the short entry, screen shot at time of exit.
Richard

PS Click on image to enlarge.
 

Attachments

  • 191208ARTC.GIF
    191208ARTC.GIF
    21.4 KB · Views: 533
Hi Mr. Charts,

Thanks for the information. I have one question; I would think this system would also work on bigger timeframes such as the daily or weekly timeframes. Is this assumption correct or does it only work on the smaller timeframes (<= 5 minutes)?

Ruben.
 
Hi Ruben,
Yes it works on higher timeframes but the opportunities are fewer on daily and weekly and the risk is far, far greater. In fact your lack of control over risk makes it dangerous.
Richard
 
Top