Best Thread How To Make Money Trading The Markets.

4 point trend definition

hi there

do you have a description of the 4 point trend definition anywhere, to go with the pictorial you included in your post?

I'd find it helpful to understand it better

thanks


Here's a brief analysis of a trade today using the method in this thread.
The stock was ANF and I found it pre-market from two sources:
1) it was a gapper,
2) the mixed Q3 guidance ahead of analyst day.

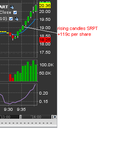
Market open and after a few minutes it created a high 'a' , then a low 'b', then a lower high 'c' , then a lower low 'd'.
This action constituted a classic four point trend definition.
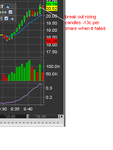
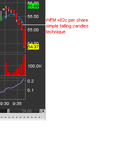
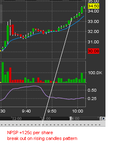
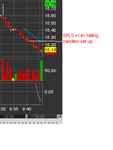
This could have then moved anywhere and after that long one candle (3 minutes) plunge it was reasonable to expect some sort of bounce so I was looking for a convincing fall below 'd' with falling candles (as described many times on this thread).
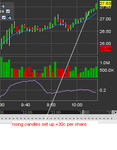
When that occurred I shorted and exited as shown on the screen grab for 64c per share profit.
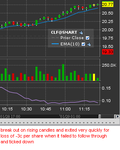
I traded ANF again a little later and lost 7c, again following my methodology of keeping any losers small.

This method (and most of the other ones I use) are applicable with only slight modifications to most trading instruments, FX, indices, whatever and also across most time frames so hopefully some people might find this post useful.
 
Another System I Like To Use

Whenever I have to use a manual set up for a quick trade, I use the 30 minute opening range. It is very reliable especially in trending markets. Here is how it works:

1) Just pull up a 30 mi chart of the stock that you are targeting for a trade. This should be done as soon as the market opens.

2) Wait for the first 30 minutes to elapse.

3) Draw a line at to mark the high of the 30 minute opening range

4) Draw a second line to mark the low of the 30 minute opening range.

Once the stock rises/breaks above the top of the range you can go long. Similarly, if it breaks below the low of the range, you can go short.

The main idea is that the high or low of the day is usually made in the first 30 minutes of the trading session. This is true about 78% of the times. It has been a consistent strategy especially for quick day trades.

It is not new and has been around for many decades ( probably had its genesis on the floor of the CBOT)

Its a nice quick go-to strategy. Hope this helps someone.
 
Here are my two trades in SRPT today.
There was a news story pre-market and it gapped pre-market so was on my alert list.
It set up the particular method in this thread and I went long where indicated and then exited at the time of the screen grab for a profit of 119c per share.
I could have gone long earlier but was concentrating on another trade so missed the opportunity of making more than 119c per share. When I am busy watching the stocks in my alert list and scanning for new opportunities I do sometimes miss the best entry point even if there is excellent price action, but I'm happy to get profits, especially large ones, of course.
 

Attachments

  • 121213SRPT.PNG
    121213SRPT.PNG
    10.8 KB · Views: 292
A little later after a short period of consolidation SRPT broke out and I went long again. This time, however, it quickly reversed and I exited for a loss of 13c per share.
I always aim to keep losses as small as possible and when the chart and/or price action moves against me I always exit and take the loss. I never, ever, hold on in the "hope" or the "wish" it will turn back in my favour. In my experience they continue to move against you after the exit 75% of the time. And trading is a probability business with no absolute certainty.
 

Attachments

  • 121213SRPTsecondtrade.PNG
    121213SRPTsecondtrade.PNG
    11.4 KB · Views: 223
Hazaa! I finally finished this thread!

Thanks Mr. C for a very interesting and inspirational thread.

I'm not sure I understand all the negative comments - I for one would not be interested in seeing your statements! It would show me your trading, but not mine!

When I have time, I will be looking at creating my own system based on some of your ideas (not all!) and paper trade it to my own satisfaction to see if I'm happy with it before putting any money into it. It's obvious that your trading methodology has grown to something that has rules that bend to various degrees because you have the years of experience day-trading necessary to be able to bend rules in your favour. I will be attempting to work out rules that I can stick to rigidly to get going (if it ends up being something I decide to pursue).

At present I trade longer time frames, trend following, and have had success by approaching it in this manner. It has been hard work, and has required discipline, and I expect working on a shorter time frame will require even more hard work and discipline.

Thank you for the thread, and I hope you don't let the trolls get the better of you. I can understand cynicism, and will apply a healthy amount to any work I do, but I am not sure where some of the anger comes from! Best of luck for 2014.

Tony

My pleasure, I'm glad you've found it useful
Richard
 
Here's one from today.
Five minutes after open I ran a scan for biggest fallers and saw WFM.
Apart from the first candle when price was all over the place, every candle had a lower low and a lower high than the previous one indicating strong selling/shorting so I simply shorted being ready to buy back on any sign of the downwards rush abating.
Of course, had I ran the scan a couple of minutes earlier I'd have shorted it earlier !
I expected this to be profitable but was ready to keep any loss very small by immediately exiting if it did go against me.
I am always aware that volume blow offs can reverse quickly so I'm always ready to bank a good profit. I never expect the whole pie, just a slice keeps me happy.
+82c per share
 

Attachments

  • 060114WFM.PNG
    060114WFM.PNG
    8.4 KB · Views: 267
This particular method is hardly rocket science and I use several other set ups and techniques in my day to day trading, but even using this one method alone can prove very profitable. After all, what you are basically doing is to jump on a trend, and ride it till there are indications it might fail. If it fails immediately or shortly after entry, you simply exit and take a small loss, small gain or bigger gain.
Of course you are not going to constantly find big trenders all the time, though there are usually several around with US stocks. You just bide your time for ones like WFM. Like a sniper, you don't just go shooting from the hip, you wait for the best opportunities.
Richard
 
Here's another one from today.
I read news stories before the market opens, both from the previous evening's post-market news flow and from the morning's pre-market news flow so NPSP was on my pre-market alert list. It also gapped pre-market.
It opened and shot up, then reversed quite strongly, more than I normally like to see.
It then worked its way back up, forming a couple of higher lows on the way till it broke to a new high on the rising candle set up I've described on this thread, at which point I went long. It wasn't an ideal set up, but still had a very good probability of success.
If it had failed I'd have exited very quickly for a small loss, but happily it continued to rise for a profit of 125c per share.
Richard
 

Attachments

  • 080114NPSP.PNG
    080114NPSP.PNG
    12.1 KB · Views: 286
Good job! Nice set-up too - in fact I often use an almost identical set-up ;)

Most of all, I like this line: "...If it had failed I'd have exited very quickly for a small loss..." New traders on this site could learn a lot studying that and your last few posts.

One quick question if I may: how have you found the impact of HFT algo's on your US equities day trading?

I use 14 set ups, of which this thread is about one and this one is completely unaffected.
Of my other set ups about four of them have been affected marginally only. To put it another way, three of those set ups have a hit rate of about 58% whereas a few years ago they were nearer 63%. The other set up worked about 67% and is now 62%.
All my other set ups work as they always have since I gave up my profession to trade for a living in 2000.

Good trading to you,
Richard
 
Last edited:
I ran a scan 9 mins after open and saw SPLS and using this method jumped on board for +14c per share.
Exit was when buyers came in.
I wasn't looking for a target gain or being greedy wanting more, just concentrating on getting out if it went against me and letting it run till there was a sign of a potential reversal.
Method, method, method.
Repetitive, repetitive,repetitive.
Profitable, profitable,profitable.
Satisfied,satisfied,satisfied.
 

Attachments

  • 090114SPLS.PNG
    090114SPLS.PNG
    9 KB · Views: 303
BBY was on my pre-market alert list due to the news and the huge gap down.

This chart is not ideal, but the tendency was upwards and when it broke to a new high it did so on the rising candle method in this thread. In other words after a weak uptrend it became quite strong. I went long at the point indicated and exited at the time of the screen image for +30c per share.
Stocks do not have to start out strongly, they can become strong as this one did.

The other point is that most people seem very reluctant to buy a gap down stock, or short a gap up stock. They seem to have the false idea (and there are very many myths and misunderstandings in trading which stop people from consistently making money) that if price gaps up strongly it is likely to move up after open, and vice versa. Absolute rubbish, just like that hairy old chestnut that gaps have to close. Anything can happen and usually does.
Richard
 

Attachments

  • 160114BBY.PNG
    160114BBY.PNG
    12.7 KB · Views: 273
. . . and there are very many myths and misunderstandings in trading which stop people from consistently making money . . .
Hi Richard,
It's been a while since you started a 'serious' trading related thread and this strikes me as being an excellent topic - although some thought might need to be given to the thread title! I'd be very interested to hear your thoughts on this - and others would be too, no doubt.

Go on - you know you want to!
:p
Tim.
 
DowJones and dojistar,
Thanks for the kind words. It's always a pleasure to read positive posts.
Richard
 
Hiya Tim,
I'm pretty busy at the moment but will think about it.
Shakone started a similar and excellent thread recently but it never really got going and didn't get the attention it deserved.
Richard
 
Here's one from yesterday that failed using this particular method.
If the stock doesn't do as it should do and starts to reverse I simply exit. IMHO one of the vital parts of trading is to keep the losers small.
CLF lost -3c per share
 

Attachments

  • 290114CLF.PNG
    290114CLF.PNG
    13.8 KB · Views: 305
  • Like
Reactions: BSD
Top