bnaimy
Established member
- Messages
- 812
- Likes
- 55
Hi Bashir
Thanks for the new rules.
I have to say though I'm not getting any trade signals, especially since we started using volume value area lines. and since the 3 minute always has to be on your side. it seems the 3 minute always starts to look ****ty when doing a pullback.
could you post your trade times from 1 day so i can see what i'm doing wrong?
thanks!
Hi Laser, what i suggest is that you loose the mid line, the most importent lines are the upper and the lower lines. Just be very carefull with the top line and lower line.U will notice that alot of buyers will come into the marked when price get to the lower line, and alot of shorters will come over if they price gets to the upper line.Just be very carefull, most of the times it will test that line and bounce back up, unless everything is pointing up, its actualy a way of trading that as well and its a high propabilty trades at that point, if 10min stoch is overbough and so is the 3min u can just short it a few ticks below the topline and watch it just rocket down again.Works everttime 😀
Same goes for the downside, but on the short on the upside workds the best, takes more to get investors to buy it then to sell it, especiall in a marked like this.
So just remove the mid line and your will do great, just follow the rules.
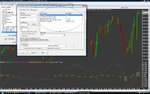
Also i highly recommend you use a whilder's moving average on the your slow stochastics, otherwise the 3min will look like **** many times and scare you out. If you use a simple ma on the slow stoch, it will react to much to price action and wigggle alot.If you dont have that, try using a macd with these settings, this settings are tight enough to works as your slow stoch with whilder's ma.
Please have a look at the picture with the settings
With kind regards
Bashir Naimy
With kind regards
Bashir NAimy
Attachments
Last edited: