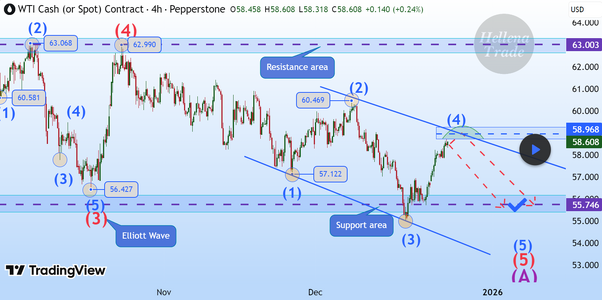
#Oil
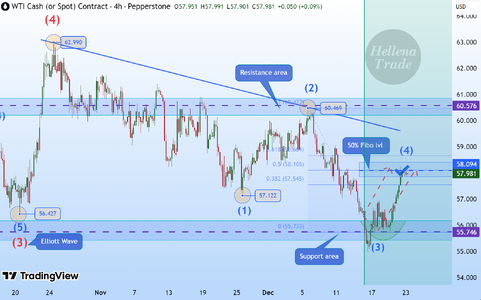
✔️🛢Oil (4H): LONG to 50% Fibo lvl (58.00).
➖➖➖➖➖➖➖➖➖
Well done
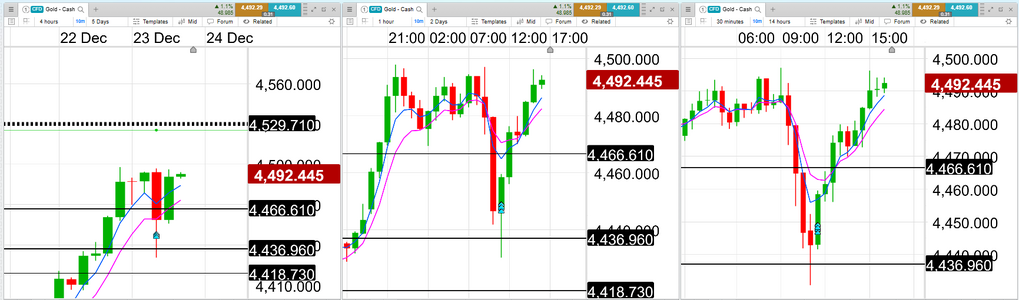
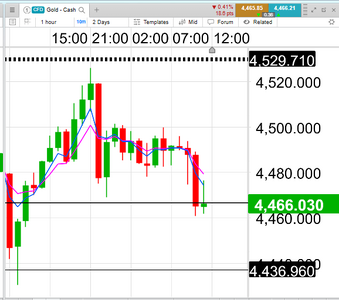
#GOLD
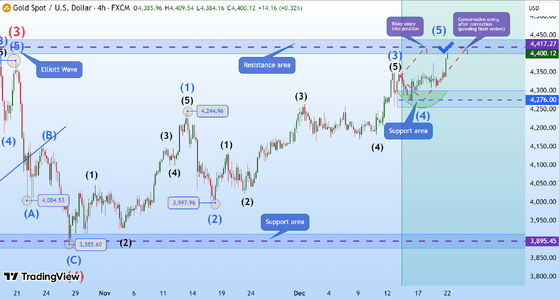
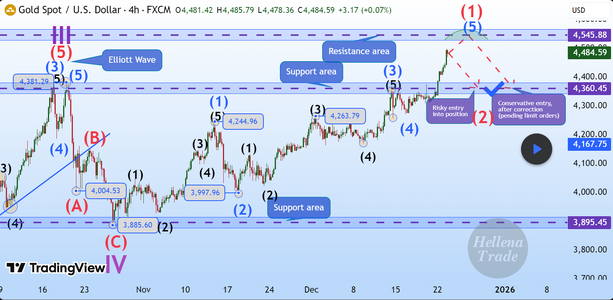
🥇 GOLD (4H): SHORT to support area of 4360 (Correction).
➖➖➖➖➖➖➖➖➖
➡️Colleagues, the price has shown fairly steady growth, reaching a new historic high, and I believe that a correction is not far off.
So, at the moment, wave “1” of the higher order is coming to an end, and I expect this to happen around the 4545 level, followed by the start of corrective movement “2” towards the 4360 level — this is the minimum target. Of course, I expect a deeper correction, but I prefer to take more likely targets.
I would also like to point out that the price may already begin its correction, which would mean that wave “1” is already complete.