I've decided to start this thread since I bagged a copy of the above system a few months ago and I wanted to see if it was any good.
It's been around for a while apparently and marketed to death by the usual suspects, so naturally I was a bit sceptical, especially since one or two of these suspects would sell their own grandmother for a few bucks
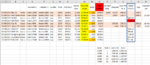
I finished some back-testing of this to the start for 2016 and so far I do think this has some legs to it. The results were good but back-testing is never easy and the best way to find out for sure is to to make some trades, either in a demo a/c or live, when the signals indicate that a trade is 'on'.
My manual is from Feb 2015 and the % target profit is 5%, although it talks about having a lower % if required. Stake depends upon size of bank, attitude to risk etc. The manual uses a 14% risk which is what I have used for testing purposes and in my demo a/c. Trades I've decided to take on in my live account, I've used 10% (the manual gives examples of 10%, 7.5% & 5% so you can use what risk you feel comfortable with)
The stake is calculated by dividing the maximum risk amount £ by 10% of the index price (it's always 10%) as in this example:
Bank, %Risk, Max risk, Index price, Stake,
£10k, 14, 1400, 11200, 1.25,
I have made a number of changes to the system:
1. I use a trailing stop loss to lock in profits as I have seen wild swings from profit to loss in a matter of weeks or less.
2. The manual says that unless both signal indicators change to opposite sides of the candlestick, you leave a trade open until it hits the stop or limit. I don't like this approach and would prefer to see a trade closed in either the current quarter or at the very latest, the following one.
3. There is another rule which I ignore and that's the one dealing with potential signals i.e. The candlestick is the wrong colour but events could change etc. Too much faffing about for me.
This is just me though, I've found most systems I've come across are utter rubbish and others are too rigid in their rules, but some have useful ideas.
Tomorrow I will post details of actual demo trades opened.
If anyone is or has used this system, it would be good to hear your thoughts on it
Regards
Becks
It's been around for a while apparently and marketed to death by the usual suspects, so naturally I was a bit sceptical, especially since one or two of these suspects would sell their own grandmother for a few bucks
I finished some back-testing of this to the start for 2016 and so far I do think this has some legs to it. The results were good but back-testing is never easy and the best way to find out for sure is to to make some trades, either in a demo a/c or live, when the signals indicate that a trade is 'on'.
My manual is from Feb 2015 and the % target profit is 5%, although it talks about having a lower % if required. Stake depends upon size of bank, attitude to risk etc. The manual uses a 14% risk which is what I have used for testing purposes and in my demo a/c. Trades I've decided to take on in my live account, I've used 10% (the manual gives examples of 10%, 7.5% & 5% so you can use what risk you feel comfortable with)
The stake is calculated by dividing the maximum risk amount £ by 10% of the index price (it's always 10%) as in this example:
Bank, %Risk, Max risk, Index price, Stake,
£10k, 14, 1400, 11200, 1.25,
I have made a number of changes to the system:
1. I use a trailing stop loss to lock in profits as I have seen wild swings from profit to loss in a matter of weeks or less.
2. The manual says that unless both signal indicators change to opposite sides of the candlestick, you leave a trade open until it hits the stop or limit. I don't like this approach and would prefer to see a trade closed in either the current quarter or at the very latest, the following one.
3. There is another rule which I ignore and that's the one dealing with potential signals i.e. The candlestick is the wrong colour but events could change etc. Too much faffing about for me.
This is just me though, I've found most systems I've come across are utter rubbish and others are too rigid in their rules, but some have useful ideas.
Tomorrow I will post details of actual demo trades opened.
If anyone is or has used this system, it would be good to hear your thoughts on it
Regards
Becks
Last edited: