You are using an out of date browser. It may not display this or other websites correctly.
You should upgrade or use an alternative browser.
You should upgrade or use an alternative browser.
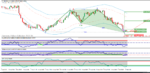

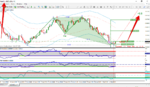
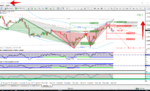
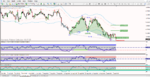
nzdusd 4hr
as indicators started to come out of 30 my trade is in +9 PIPS.. 🙂
This is Type 1 Trade
All 3 indicators are coming out of OVERSOLD 30 so this trade is Valid for Execution and TRADE Management there is an Primary 45 Degree Trend line, when price breaks this TrendLine ,Trade becomes INVALID
as indicators started to come out of 30 my trade is in +9 PIPS.. 🙂
Attachments
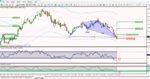
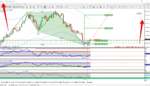
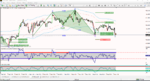
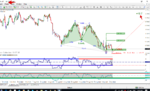
nzdusd 4hr
Now +30 PIPS
as indicators started to come out of 30 my trade is in +9 PIPS.. 🙂
Now +30 PIPS
Attachments
Attachments
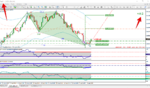
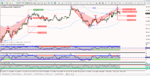
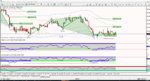
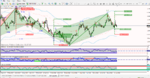
nzdusd 4hr
+130 PIP
AMPRSI & HSI are at Extreme Zones. so I am looking to close half of my position in case of a reversal back into the PRZ
Now +40PIPS
+130 PIP
AMPRSI & HSI are at Extreme Zones. so I am looking to close half of my position in case of a reversal back into the PRZ
Attachments
![[EURUSDc,H1].png](/data/attachments/130/130813-c4c4b91ca0a7f81197678d586a8b384b.jpg?hash=xMS5HKCn-B)
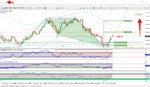
Eurusd
EURUSD 1HR Butterfly
This is Type 1 Trade
All 3 indicators came out of OVERSOLD 70 so this trade became Valid for Execution and TRADE Management there is an Primary 45 Degree Trend line, when price breaks this TrendLine ,Trade becomes INVALID
1HR Butterfly or Bat waiting for Reversal
EURUSD 1HR Butterfly
This is Type 1 Trade
All 3 indicators came out of OVERSOLD 70 so this trade became Valid for Execution and TRADE Management there is an Primary 45 Degree Trend line, when price breaks this TrendLine ,Trade becomes INVALID
Attachments
Last edited:
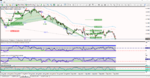
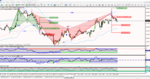
Audusd 4hr
+10pips live
4 hr pattern t2 trade
price is in prz zone & indicators are below 30,
so when these indicators come out of 30 , trade becomes valid
+10pips live
Attachments
![[EURAUD,Weekly] Butterfly.png](/data/attachments/130/130869-a9aaaef3b6b450d9a5e4c5a14632a769.jpg?hash=qaqu87a0UN)
![[AUDJPY,Weekly]T2 Crab.png](/data/attachments/130/130870-47b989ae47bcba24b27397d1e1b56d51.jpg?hash=R7mJrke8ui)
![[AUDUSD,Weekly] Crab.png](/data/attachments/130/130871-ff32fd8a77cada0dc3df428e3a4aea13.jpg?hash=_zL9infK2g)
![EURNZD,Daily] BUTTERFLY.png](/data/attachments/130/130887-4c0a4fdf35826b53ce6a2658f75e8ac2.jpg?hash=TApP3zWCa1)
![[NZDCAD,H4]BAT.png](/data/attachments/130/130888-87890f06f36a20ef0f81f32c5c246afe.jpg?hash=h4kPBvNqIO)
Similar threads
- Replies
- 0
- Views
- 3K