Grey1's US trades using VWAP

Paul,

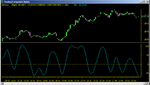
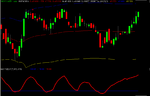
I would look at MACCI on NAS chart because as you know I have only access to 40 NAS stocks for the time being//( IB restriction ) IF MACCI was above 100_130 then I would wait to see the reaction of other players on L2 if NAS started to pull back a bit.

It would be silly to take a postion when NAS is OB and Goldman sitting there with 3000 bidding say 20 C below the VWAP signal ..
 
Last edited:
This is today's Nas chart.. Osciallators are not suppose to work on strong trending days but look at MACCI .. It has reasonably called the pull backs .. So it would be vital to fine tune your entry with the market and the reaction of other players on the pull backs ..

PS:-- Just noticed MACCI on your own chart .. It has not done a bad job either... :D
 

Attachments

  • nas.png
    nas.png
    10 KB · Views: 997
Last edited:
Ron,

The attached screenshot is of my Quotetracker level II setup.
Note that on the left is the Level II screen with all players. In the
centre is the time and sales window and on the right is the Island
book orders which are useful to have when placing orders.

This costs me $30 per month from money.net and I am very
pleased with what I have. There are other level II setups such as
esignal and others but this is all that I need.

I hope it helps.


Paul
 

Attachments

  • qt l2.png
    qt l2.png
    21.9 KB · Views: 756
Paul
Thanks for that - do you find the Quotetracker ads a nuisance - do you think it worth registering and paying for ad free
You may like to comment further by pm
Ron
 
Paul,

May I ask what software were you using to chart the 'MEDI' trade with the 'VWAP bands' further up this page?

Thanks.
 
Grey1 said:
...
MPD bands or maximum permissible deviation =( High _low)/2

The upper and lower bands then becomes VWAP + MPD and VWAP – MPD
...

Hi Grey1,

Could you just clarify the formula for MPD. And the MACCI formula. If you have them already in TS that would be great :)

Thanks

mmillar
 
Last edited:
Trader333 said:

That chart was from Tradestation 2000i


Paul

Paul,
Do you use TS aswell as QT for charting?

Is it possible to show this in esignal?

What is MACCI? (Sorry)

IanH
 
I use Quotetracker primarily for Level II and Tradestation for the
more complex charts. As I dont use esignal I am unable to say if
you can show the above in it or not.

MACCI = Moving Average Commodity Channel Index


Paul
 
Thanks Paul,
I just had an e-mail from another trader who has written a study for esignal, so I will try that.

Does your QT give you the VWAP data, as we use QT & esignal.

IanH
 
Ian,

Yes QT does give VWAP but not the outer bands as shown in the
above charts. Attached is an old screenshot and you will see three blue lines. One that is horizontal and this is pegged to the current vwap (it just allows you to see the price that vwap is at), and another that is the vwap where the trade was exited at. The third blue line is just a MA of price.


Paul
 

Attachments

  • teva.png
    teva.png
    11.8 KB · Views: 797
Ian,

No Quotetracker does not provide the MPD either side of the VWAP (which is what I called outer bands). The top line is the VWAP and that is all QT currently provide.

You will see that I entered a Long position that was well below the VWAP line and when the price hit VWAP I sold my position. The confusion is because I had scrolled back to where I took the trade but the Horizontal line seen is at the current VWAP price which was sometime later.

Sorry for any confusion.


Paul
 
Martin ,

yes I do have the code for the MACCI and I will be sending it to you troug a PM ..

CCI is very fast and I needed to slow it down a bit.. So I put it through a simple MA filter.. The better filter would be autoregressive MA ( ARMA) which comes as standard in realtick and is pretty predictive , however the one Paul is using on TS is pretty good too.


regards
 
Last edited:
Short YHOO trade,

The reasons for taking the trade.

Market is weak so I am going to go short..
Yhoo is trading at its Upper VWAP so my risk is minimum
There is a bid sitting there on L2 for 7850 shares @ 48.

very low risk Trade

Trading becomes business if one has a solid and logical strategy
 

Attachments

  • yhoo1.png
    yhoo1.png
    22.9 KB · Views: 710
Entry is 48.37 .. I have a MM stop ( I have outlined it in my previous posts ) but one could use +,- 5C ( your own pain level ) from the upper band for the stop .. Blue line is the Upper Band..
 
It seems a bit dodgy going short in this bull market even when there is a whiff of bad news - any decline is just seen as a buying opportunity....

YHOO now 48.57 - Nasdaq in the green again
 
Top