GREY1 P/L daily

Grey1 said:
Sorry RAJ I just saw your post

I am so so so sorry could not reply earlier as I have loads and loads of work on my shoulder at the moment and I donot get the chance to get on the BB fast enough

I will reply after hours buddy

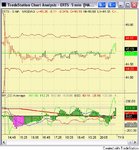
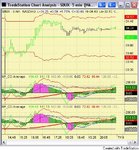
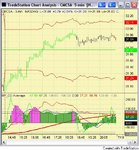
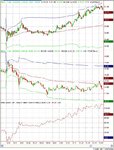
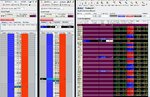
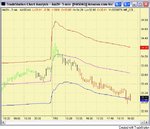
I traded the market to day while doing some thing else ( testing new platforms on another computer ) as well as looking after a new born baby . I am up $1653 The exhaustion engine is my crystal ball guys CODE it and pray for my soul.

No prob Grey1- I can wait- enjoy parenting, that I feel is a blessing from the person above us and on the other note -the more you try new systems, my hopes of learnig new trading ideas are raised.. :D .
Congrats on your trading today.

Raj
 
No more trading for me today An easy peasy day as the signals were sharp and entry was awesome and not a loss on an individual stock as seen on the screen shot ( lost few trades though )

up $ 2083 ma ma mia

I am having a trading competition in my house on Monday with few traders fro this BB .. I am really looking for ward to that

Grey1
 

Attachments

  • tradessss.jpg
    tradessss.jpg
    711.1 KB · Views: 61
  • yeahbaby.jpg
    yeahbaby.jpg
    675.5 KB · Views: 62
Last edited:
rajibde said:
Sorry I was not clear enough-

I assumed that you've shorted JOYG at around 1510 based on strategy 3 (dow MACCI >120 at three time frames)- as I do not have MACCI in the 'quote tracker' I tried to see the CCI for the dow at this time and it appeared to be >120 only in the 1min time frame and not in the 3 & 5 min time frames. But I see the point, the CCI as you say is fast and therefore might have been indicating incorrectly. Is there any way the CCI can be 'tamed' down in the QT?

By target, I meant the predicted/calculated outcome of the trade before entering the trade; as in the strategy 1, you've mentioned, the predicted profit is the price between the MPD and the VWAP, I was thinking is there a way how the same can be calculated in relation to strategy 3 (as the price drop did not continue till the lower VWAP line in this case)?

I hope I'm a bit more clear ...:)

Raj


Quote


I assumed that you've shorted JOYG at around 1510 based on strategy 3 (dow MACCI >120 at three time frames)- as I do not have MACCI in the 'quote tracker' I tried to see the CCI for the dow at this time and it appeared to be >120 only in the 1min time frame and not in the 3 & 5 min time frames. But I see the point, the CCI as you say is fast and therefore might have been indicating incorrectly. Is there any way the CCI can be 'tamed' down in the QT?


Sorry I have no idea but one thing I know CCI as it is , must be tamed to capture the true cycle inherent in the stock price.


Quote

By target, I meant the predicted/calculated outcome of the trade before entering the trade; as in the strategy 1, you've mentioned, the predicted profit is the price between the MPD and the VWAP, I was thinking is there a way how the same can be calculated in relation to strategy 3 (as the price drop did not continue till the lower VWAP line in this case)?


Yes use Exhaustion engine on the stock to exit as a predicted target. When MACCI stock in three time frame is OB or OS we close


HOW MANY OF YOU HAVE MANAGED TO CODE THE EXHAUSTION ENGINE ?

Grey1
 
Grey1 said:
Quote


I assumed that you've shorted JOYG at around 1510 based on strategy 3 (dow MACCI >120 at three time frames)- as I do not have MACCI in the 'quote tracker' I tried to see the CCI for the dow at this time and it appeared to be >120 only in the 1min time frame and not in the 3 & 5 min time frames. But I see the point, the CCI as you say is fast and therefore might have been indicating incorrectly. Is there any way the CCI can be 'tamed' down in the QT?


Sorry I have no idea but one thing I know CCI as it is , must be tamed to capture the true cycle inherent in the stock price.


Quote

By target, I meant the predicted/calculated outcome of the trade before entering the trade; as in the strategy 1, you've mentioned, the predicted profit is the price between the MPD and the VWAP, I was thinking is there a way how the same can be calculated in relation to strategy 3 (as the price drop did not continue till the lower VWAP line in this case)?


Yes use Exhaustion engine on the stock to exit as a predicted target. When MACCI stock in three time frame is OB or OS we close


HOW MANY OF YOU HAVE MANAGED TO CODE THE EXHAUSTION ENGINE ?

Grey1

Thanks Grey 1 for your reply. (I now need to get my head aroud the 'exhaustion engine')
Raj
 
Hi

i've managed to use it so far, but still have the problem which Mr.Ian(who helped me alot) described .here . main prob is my little knowledge with TS2000i(it's really an advanced and sophisticated piece of software, lots of tricks, options to manage), so we can't have shots. like yours. anyway the alternative way(opening 3 seperate Radar Screens), is present, but sucks the resources out, as RS are CPU&RAM hungry. it'd be better to have all 3 of them in 1 RS, and set an alert for them(as u did :eek: )

Regards
.........................................
Kako

HOW MANY OF YOU HAVE MANAGED TO CODE THE EXHAUSTION ENGINE ?
 
VWAP example

Hi Grey1

I was backtesting your pair trading strategy. I would have done the following during the first 30 mins period ( suppose that it is okay to trade during the opening 30mins). I would have

Short ERTS @45.50 for 50p target.
Long SBUX @33.60 for 40p target.

I use my own paintbar indicator to see the bias ( green for Long and red for Short).
So, I am combining two strategies, your VWAP MPD band penetration for reversal and my own bias paintbar.

One question though, CMCSA is well below lower MPD band since the opening. It is safe to go long while it is below lower MPD band? Better to wait till it breaks out lower MPD band?

Please look at my charts if the VWAP line and MPD bands are correct. Green line is VWAP and red channels are MPD bands.

Thank you so much and god bless you!!
 

Attachments

  • ERTS_060717.jpg
    ERTS_060717.jpg
    65.6 KB · Views: 76
  • SBUX_060717.jpg
    SBUX_060717.jpg
    76.2 KB · Views: 59
  • CMCSA_060717.jpg
    CMCSA_060717.jpg
    70.3 KB · Views: 41
Last edited:
leovirgo

I too am working on a pairs trading strategy based around VWAP bands etc.

I am having trouble seeing your entry point based on VWAP (see attached) SBUX hardly dips under VWAP until after 10:00ET by which time your entry price short on ERTS is long gone. Personally I find the 1st 30 minutes hard for VWAP based pairs as you get a lot of stocks at the upper or lower band which will probably reverse at some point but have quite a bit of opening momentum which can carry them quite a way. I am not very good at reading the turning points early in the session (certainly not on two stocks at the same time). I tend to wait till 10:00 ET.

Regards,

Gareth
 

Attachments

  • sbux-erts060717.jpg
    sbux-erts060717.jpg
    153.4 KB · Views: 54
garethb said:
leovirgo

I too am working on a pairs trading strategy based around VWAP bands etc.

I am having trouble seeing your entry point based on VWAP (see attached) SBUX hardly dips under VWAP until after 10:00ET by which time your entry price short on ERTS is long gone. Personally I find the 1st 30 minutes hard for VWAP based pairs as you get a lot of stocks at the upper or lower band which will probably reverse at some point but have quite a bit of opening momentum which can carry them quite a way. I am not very good at reading the turning points early in the session (certainly not on two stocks at the same time). I tend to wait till 10:00 ET.

Regards,

Gareth

Hi Gareth

Thanks for your reply. Probably the system error on my side due to ..

1. I used TradeStation's built-in VWAP indicator for Radarscreen.
2. The charts were generated after the market close yesterday.

As a result the VWAP plotted on the chart may be wrong. As of now, VWAP is set to 'zero' on my radar screen. Do you think I need to use custom VWAP indicator?

regards
 
Generally I wouldnt take a pair trade until after the first 30 minutes of trading and only on days where the market is range bound.


Paul
 
I think some traders carry over vwap from [-1] for the initial period and then switch over to vwap latter on.
 
leovirgo

There is a current post today elsewhere on T2W by Twalker giving a VWAP function called VWAP_H. This looks to me like it will work fine and it will be a good retrospective chart plot also fine for live signals in radarscreen

Tradestation quoted VWAP is fine for live signals and I tend to assume it is the most accurate but I could be wrong. If you put it on a chart you only get the current value as a flat line. As the chart builds it plots OK but when you swap symbols in the chart you get a flat line again (hard to describe - try it and see). I have it on my chart as a warning in case my function is going wrong (if you look at my posted charts I think you can see it as a light blue line). But it is no use for looking back at end of day.

Hope that makes sense - in summary use Twalkers code

Gareth
 
hi

gareth, i had same confusion with VWAP line being a horizontal line, here's the clue: double click on chart(i.e go to format symbol) and change the setting of volume part to "Trade Volume".

hope this helps(it took me looong time to discover that)
............................................
Kako

Ps. i'd appreciate if some1 could answer me and Mr.ian's issue here.
 
Kako

Sorry forgotten your post on Grey1s radar screen. I don't have his code but what mine does (and it is based on what I deduced his was doing by looking at his screen shots) is - there are 4 radar screens with the same symbols. 3 of them have an indicator which calculates MACCI and sets a global variable. Each of these 3 have different timeframes (1,3 and 5 mins seems to be the favourite). The 4th one has an indicator which reads the 3 global variables and calculates exhaustion based on all three together the timeframe of this radar screen may not matter. He has sent you various indicators I suspect try looking for one with perhaps "receive MACCI" or "get MACCI" or some such in the name for the 4th screen pulling them all together. Just guessing.

Gareth
 
garethb said:
leovirgo

There is a current post today elsewhere on T2W by Twalker giving a VWAP function called VWAP_H. This looks to me like it will work fine and it will be a good retrospective chart plot also fine for live signals in radarscreen

Tradestation quoted VWAP is fine for live signals and I tend to assume it is the most accurate but I could be wrong. If you put it on a chart you only get the current value as a flat line. As the chart builds it plots OK but when you swap symbols in the chart you get a flat line again (hard to describe - try it and see). I have it on my chart as a warning in case my function is going wrong (if you look at my posted charts I think you can see it as a light blue line). But it is no use for looking back at end of day.

Hope that makes sense - in summary use Twalkers code

Gareth

Hi Gareth and Kako

Thanks for your replies. I will use Twalker's formula and forward test the method. Kako, I changed the trade vol in format symbol but it is still the flat line.

regards,
 
Today's action

Long XRAY
Short MICC

I used Flat line VWAP and may be just pure luck, it worked. And I backtested with new Twalker's function and it looks alright.

One question though, does the price need to penetrate MPD band ? Is it alright to take a position once the price's approaching the band, say within 10% of the bandwidth?

thanks,
 
VWAP_H is a function and not an indicator. The function is needed first for the VWAP indicator to work.

Leovirgo,

What are you using as a data source ?


Paul
 
I have been away from the BB as I had 5 traders from this BB yesterday in my house and been out all day . Came home 5 PM and saw Market was exhausted ( from the exhaustion engine ) and immedialtley shorted RMBS, MRVL,BRCM and made $ 612 in no time what so ever. I love strategy 3.

I got out after MACCI 1 min got OS on the 1 min . easy peasy
 

Attachments

  • rmbs.jpg
    rmbs.jpg
    775.9 KB · Views: 61
  • rmbssss.jpg
    rmbssss.jpg
    239.8 KB · Views: 49
Grey1 said:
I have been away from the BB as I had 5 traders from this BB yesterday in my house and been out all day . Came home 5 PM and saw Market was exhausted ( from the exhaustion engine ) and immedialtley shorted RMBS, MRVL,BRCM and made $ 612 in no time what so ever. I love strategy 3.

I got out after MACCI 1 min got OS on the 1 min . easy peasy


PS:-- I reply to questions after the market hours
 
Trader333 said:
VWAP_H is a function and not an indicator. The function is needed first for the VWAP indicator to work.

Leovirgo,

What are you using as a data source ?


Paul
Hi Paul,

I've saved function and got VWAP indicator. I am using TradeStation as the source. Does this chart look alright to you? Pls ignore the color of the bars. thanks,..
 

Attachments

  • Amzn_060718.jpg
    Amzn_060718.jpg
    62.9 KB · Views: 50
Last edited:
Top