GOOG View, Great Upside Ahead!!!

vivekrathi

Newbie
Messages
9
Likes
0
Check Image
 

Attachments

  • Hourly.png
    Hourly.png
    50.1 KB · Views: 299
Like your logic, I see that you are looking at the hourly graph and this trade makes sense but 750 looks a stretch to me.

From oct 18 this stock has has fallen like a rock and hasn't received much love from public/fund. 680 looks to be a semi support and not a solid support. One can play very short term trading here....It seems more like lack of selling that buying power to me. From my point of view it will need solid balls to break the 707 reaction level.

I don't like to sit in front of the computer entire day so I would put order for 678 and try to get out at 707......

I would wait for this baby to break 707 level or come back to 670 range and watch its price movement to find good entry level....... again i like to watch only daily graph and during entry only i look at hourly.... that's all....

My biggest problem is we need good buying to support the trade.... until that comes.... i don't feel comfortable....

at the end... market has its own way to behaves..... and we watch its play... thats all
 
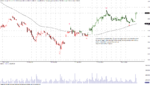
GOOG nice bullish flag setup into today, see if we can close today without a big red candle then we have a resistance gap above between 711 and 749. Price could move upward pretty fast if we get into this region. imho.

RESISTANCE ABOVE +1.1% at 711.1 ± 8.53, type single, strength 2
+6.5% at 749.1 ± 8.99, type double, strength 10
 
Top