GOOG - Long or Short......?!

$2000 in 5years!

Shoe-shine boys start talking about buying google stock!

$496 on the next wave up!

1929 - The panic on the Exchange floor changed to bedlam. According to one observer, "They hollered and screamed, they clawed at one another's collars. It was like a bunch of crazy men. Every once in a while, when Radio or Steel or Auburn would take another tumble, you'd see some poor devil collapse and fall to the floor." This was the Crash, although few could see it at the time.
;)

Today - The bump’n’run setup seems to be playing out well so far, but current support at $460ish is so far thwarting a the bears hopes for a nice 'run' phase/tank to fill some of the lower gaps….(3 in the last 9 trading days…!)

However, with algorithmic linking across the markets, stocks tend to jump when the indexes surge north, so with GOOG being a strong stock in a generally bullish market, if the Naz heads north again soon, it could trigger short stops (again) promoting more upside imho…..

As for $2000 in 5 years boy, if the next technology bull run really takes off, it could be closer than that imho…..(but they were optimistic in early 1929 as well...)
 

Attachments

  • GOOG13-01-06.gif
    GOOG13-01-06.gif
    28.9 KB · Views: 210
I missed the bus

tradesmart said:
;)

Today - The bump’n’run setup seems to be playing out well so far, but current support at $460ish is so far thwarting a the bears hopes for a nice 'run' phase/tank to fill some of the lower gaps….(3 in the last 9 trading days…!)

However, with algorithmic linking across the markets, stocks tend to jump when the indexes surge north, so with GOOG being a strong stock in a generally bullish market, if the Naz heads north again soon, it could trigger short stops (again) promoting more upside imho…..

As for $2000 in 5 years boy, if the next technology bull run really takes off, it could be closer than that imho…..(but they were optimistic in early 1929 as well...)

why do you have to be right :) well, the bump-run theory you posted a few days ago paid off here.

I missed the bus today. I ran after taken a one-dollar scalp this morning, and missed this whole thing, but I think it may not be too late yet.
$460 support is broken during after hour. Tomorrow morning's open is going to look like a huge gap down. there is a high chance that price will start slide up to close the gap. If that happens, I would just short with all mighty.
 
pssstttttt Traders,,, Keep your eyes on director's selling . last week chief financial officer and few directors sold into GOOG strength of $467 levels. So did we.

Did any of you guys noticed the AX selling on behalf of SERGY ?
Did any 1 noticed the VWAP levels of $450 on Thursday the 5th ? This was an excellent example of Algorithem (VWAP ENGINE ) trading @ 450 level

Trade like a business man .. open your eyes , don't trust TA 100% cos if you do, then you never become a trader .

BTW:- (1)yesterday sell off was only a reactionary effect to YHOO not meeting its target .. donot attach any kind of analysis to yesterdays sharp fall .. it was just a spike ..

(2) if you trading GOOG always have a chart of AMZN and YHOO open ... if you saw any obnormal activities in either of them then close GOOG unless it is in ur favour ..


Grey1
 
Last edited:
Grey1 said:
pssstttttt Traders,,, Keep your eyes on director's selling . last week chief financial officer and few directors sold into GOOG strength of $467 levels. So did we.

Did any of you guys noticed the AX selling on behalf of SERGY ?
Did any 1 noticed the VWAP levels of $450 on Thursday the 5th ? This was an excellent example of Algorithem (VWAP ENGINE ) trading @ 450 level

Trade like a business man .. open your eyes , don't trust TA 100% cos if you do, then you never become a trader .

BTW:- (1)yesterday sell off was only a reactionary effect to YHOO not meeting its target .. donot attach any kind of analysis to yesterdays sharp fall .. it was just a spike ..

(2) if you trading GOOG always have a chart of AMZN and YHOO open ... if you saw any obnormal activities in either of them then close GOOG unless it is in ur favour ..


Grey1


I agree with most of the points, but the insider selling part really should be considered positive for google. all the insider selling activitlies I have read through are automatic sells. The share size are so small comparing to what they own, option wise.

There was this director hennessy, John who hold 0 shares, and keep aquisition/sell in 100share lots, which is not that much.

then this VP rosenberg is selling in size of 6k each lot. he holds 133k. from the way it looks, it didn't really mean much. they have to cash out something to be not just paper millionairs. So far these kids have shown very good business ethical behavior, so I am not really expect them to dump even if they know some bad number coming. of course, the "ethic" usually came from the legal side. automatic sell is a very common thing throughout companies even if they are truely doing so well.


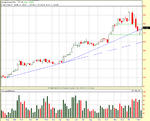
Now back to charting. this morning, google did close gap by at least 1/3. Like i mentioned yesterday, if the gap goes for a full close, I would recommend short aggressively. However, losing strength after 1/3 through is a different story. I only bought small amount of put contracts and did exit right before close.

From now on, all the bearish patterns are broken, even the up gap at october can be considered closed. The not-so-great elliot wave is near an end. between now and the earning call, there is no signals.

For the next two days, Friday is an option expiration day. we can play with those max pain numbers, 440, 450 and 460. 450 would be the most likely OE point so we can go a little bit bullish till end of Friday. However, while 440 call is priced at 8 dollars, and 430 call at 16 dollars, there is no interesting option to buy.
(risking 8 dollars for 2 dollar gain, or risk 16 dollars for 4 dollars gain, who would do that?)

At the end, the best thing to do for next two days might be just buy google at 445, hold it till end of friday and sell for a 5 dollar gain, which is only 1% gain.
 
Brin Surgey the beneficial owner sold, over 250 000 shares since 2 weeks ago. Other financial directors sold over 350 000 during late DEC and JAN .
A broad spectrum of financial directors sells since DEC 2005.

Many ,hedge funds use the sale levels as resistance.


Grey 1
 
Last edited:
Grey1 said:
Brin Surgey the beneficial owner sold, over 250 000 shares since 2 weeks ago. Other financial directors sold over 350 000 during late DEC and JAN .
A broad spectrum of financial directors sells since DEC 2005.

Many ,hedge funds use the sale levels as resistance.


Grey 1

Those are tiny numbers comparing to the big chunks they have been selling consistantly.
for brin
Dec04 - 1,200,000 sold at 179
Mar05 - 1,200,000 sold at ???
Sep05 - 1,200,000 sold at 288
He seems to sell right away whenever he makes an aquisition through his 0$ option.
comparing to those big sales in a consistant pattern, the quarter million aquisition-sale is really nothing.
I would be worried if i see a 10-million lot dump from brin any time.
last 6 month, total insider sale is 9 million versus 103 million held.

at the end, they have shown a good legal behavior, I don't even expect a big dump from them even when they know google will crash. I doubt those 31 year old kids want to go to prison while they are already wealthy. (when you are 31, it makes no sense to go to prison for 1 billion if you already have 1 billion; it makes sense to risk prison if you only have 1 million)

Now, let's look at Net Institutional ownership. the latest Qtr-to-Qtr change is a 30.4% increase. the institutional ownership would be something i recommend to watch closely instead of what Brin does.

End of January's earning report is going to be the million dollar question for all small traders. Anyone who get it right will be very wealthy.
 
Quote " I would be worried if i see a 10-million lot dump from brin any time. "

he would never do that . He is too shrewd . he would what he is doing now.. Dump them at various level as he is advised.

Quote " the institutional ownership would be something I recommend to watch closely "

Only 27% of top 10 institutions have ownership against 35% insider.. either way this is relavant to investment strategies than intra /swing strategies.

In our trading environment we are obliged to inform the CPM on any director's transaction . This is an incredibly important intra / swing trading levels. We hardly carewhat institution purchases . ( why do we hardly care ? because we are always too late to know and one would not be able to know about the transaction soon enough to trade along them . we have an option in our VWAP engine to parallel trade along side the suspecting AX which can make the life slightly easier )


A real time alert on any director's transaction is a must for intra/ position traders. Subscribe to a free alert . The free version is slightly late but at least you know what is going on under ur nose .

grey
 
Did you see GOOG being hammered to sub $400 while YHOO ( rival ) holding relatively strong ( YHOO was trading above open for most of the day till INDU took it finally down to negative territory )

Three reasons for GOOG collapse

1) Broad sellings of the stock by financial directors few days back
2) YHOO not meeting the target
3) Down grade by stifel Nicolause
4) DOW getting hammered

Did I long into the close ? Nah ,, I leave that for risk takers, gamblers, coaches,

This is my plan for Monday ( as i trader for myself on Monday )

1) wait till market open
2) if market opens in positive and GOOG gaps up then I would go long on the second pull back from the high with 2-3 ATR stoploss

3) if market opens in negative ( unlikley ) with GOOG gapping down again same as above ( i be short )

4) if Market and GOOG open in different direction then I will pair trade GOOG against a candidate meeting my VWAP criteria


PSSST next time you see a selling like below take more notice of it

http://moneycentral.msn.com/investor/invsub/insider/trans.asp?view=All&Symbol=goog
 
Last edited:
Recent Insider Trading Activity: Google Inc.
Interesting info Grey1, and we can see the results on the chart….

10/01/06
All of the gaps created by the new year rally now filled – a gap down yesterday and the run phase is now an avalanche….maybe the big gap at $330ish from October could be in the sights next…?
 

Attachments

  • GOOG20-01-06.gif
    GOOG20-01-06.gif
    30.1 KB · Views: 205
Above:-
maybe the big gap at $330ish from October could be in the sights next…?

But not yet - it's never a one-way ticket...

A big bounce to the 61.8% fib retracement level of the fall.......one unfilled gap above and two below.....

The immediate target is to fill the two lower gaps from current resistance imho, but tight stops rool as the bulls may have their eyes on the upper gap first.... ;)

(the pivots points generated in SierraCharts giving a nice S/R register..)
 

Attachments

  • GOOG24-01-06.gif
    GOOG24-01-06.gif
    22.8 KB · Views: 190
it should be fun to trade GOOG to day

A broad range of Down grade and Up grade by Wall Street Analysts on last night's result . ( That tell you nothing )
All kinda questions on GOOG as a business ( that tells you a little ) .

Things we know as technician are:-

1) Momentum traders should pull out so we should expect consoldation at least for next few days

2) There will be a Spike on last night result @ Open .
3) Spike Trading is dangerous with huge rewards for gambler
4) There will be a continous reversal buying by un skilled traders

Advise for Spike Gamblers
1) Spike Gamblers calling them selves gap traders should allow wide stop loss equivalent of at least 4 ATR (yesterdays ) . This in turn implies a small postion

2) Dont let the profit run ... Once in proft 2 times bigger than your Stop loss close postion .. repeat on oscillation .. ONLY THE FIRST 15 MINUTES

3) Reduce postion size after the first win . Increase Position after after the first loss ( remember you are gambling Hence Anti Martingle )

Advise for More mature traders :--

They donot need my advise. They have already proved to be worthy of this game.


Grey1
 
Last edited:
Sometimes stocks and other instruments seem to price at the Fibonacci numbers:
1, 3, 5, 34, 55 etc.

Google seems to be pricing at the Lucas fibonacci ratio numbers:
1, 3, 4, 7, 11, (14), 18, 28/29, (36), 47, 76.

Since it hit 470 – 47 and dropped to 360 – 36 is a composite of 18x2 as is 72 – 36x2, it doesn't seem unreasonable for it to drop to 280/290 area.
 
Grey1 said:
Advise for Spike Gamblers
1) Spike Gamblers calling them selves gap traders should allow wide stop loss equivalent of at least 4 ATR (yesterdays ) . This in turn implies a small postion

2) Dont let the profit run ... Once in proft 2 times bigger than your Stop loss close postion .. repeat on oscillation .. ONLY THE FIRST 15 MINUTES

3) Reduce postion size after the first win . Increase Position after after the first loss ( remember you are gambling Hence Anti Martingle )

Advise for More mature traders :--

They donot need my advise. They have already proved to be worthy of this game.
Damn! Followed your points 1, 2 and 3 before realising you were joking.

I've blown my entire account - again.

Can you pop a cheque in the post mate? Cheers.
 
GOOG Weekly Chart

Attached is a weekly chart which, for the first time in the stock's short history, is hinting at a possible trend change. I say "possible", because this all depends upon what constitutes a trend change. However, the evidence in favour of a down turn in trend, based on the weekly chart, is as follows:
1. The January high is marked by a doji.
A doji is generally thought to imply that sentiment is in a transitional phase. In this context, many traders will view this as an early sign of a possible trend reversal.
2. The fall since the highs has been dramatic, with very wide range bars accompanied by heavy volume. The first - and largest - of these saw the stock find support at $400. At the start of the following week, buyers rallied, but the week ended with strong selling pressure, evidenced by the large upper shadow on the candle.
3. During the last week of February the $400 support level was blown away.
4. The secondary (blue) trend line was breached in the first and second weeks of February, forming a prospective new lower low at $340.
5. The bulls will have taken some comfort from their efforts the week before last, closing up $22 on good volume. However, there was no follow through last week. Both candle and volume are less than half the size of their respective counterparts in the penultimate week. This suggests that buying pressure may not be sustained and that a test of the $340 low is on the cards. If it is breached conclusively, a new down trend could be underway.
Tim.
 

Attachments

  • GOOG_24.02.06.PNG
    GOOG_24.02.06.PNG
    42.1 KB · Views: 262
Tim,

In my view the up movement has been accompanied by much lower volume than the recent move down. Whilst you can never be sure it looks to me as if it is a minor retracement prior to a further move down.

Of course we will soon know


Paul
 
There's also been a lot less money (volume) in the markets across the board recently. So extra care is required in assessing stocks in relation to historical volume and volume/price action dynamics. Especially this stock.
 
That's quite right Brambs. Where have all the Traders gone, I wonder?
 
Rols, I think you've hit the nail on the head.

Where have all the Traders gone indeed - it's just the traders trading at the moment by the looks of it.

It's all a question of Capital. :LOL:
 
Top