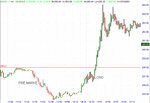
GOOG - Long or Short......?!

User - this is a very volatile stock; the price now hovering over an almight gap and in double top territory....

I've just cashed out at $226ish - too tempting as it could test $200 support later, but will it fly above $230.......?

I can always get back in again; minimal spread when trading direct access....

Good Luck
 
GOOG has been brilliant this week and indeed the last week in particular.

I took +743 out of it on Mon and +528 out of it on Tues and posted all entries live on the web.

Here's my Tues move for interest.
 

Attachments

  • aaab.gif
    aaab.gif
    14.3 KB · Views: 201
  • aaaa.gif
    aaaa.gif
    2 KB · Views: 141
Any ideas on when this will stop rising. Analysts are now calling for $350.

This is getting silly now, must be a good short opportunity sometime soon.
 
If I really knew the answer to that question I would be re mortgaging the farm.

I suppose it is probably best to watch from the sidelines at present, the opportunity to short will come within the next 4 weeks or so and there will probably be at least a 20% correction. The problem is that those Wall Street analysts keep coming up with wilder valuations and the lumps pile in.
 
........the opportunity to short will come within the next 4 weeks or so and there will probably be at least a 20% correction......

On what basis is this prediction based upon ?


Paul
 
Google is to be included in the NASDAQ which has led to a lot of buying by the index tracking funds. Once their requirements have been satisfied it will revert to being a stock that is priced on expectation as opposed to a must have.

In most cases there is a run up in the stock until it officially joins the index and then there tends to be a retracement.
 
LION63 - can you statistically prove this? ;) ..any recent examples to cite? an interesting hypothesis for sure..
 
JKLondon you have asked an honest and reasonable question but you must forgive me if I say NO. I have never kept such detailed records or data on such things. However, the next time there is a change due in the FTSE constituents or the S&P, monitor the movement of the new entrants versus the ones on the way out. The incomers' share prices will rise and the ones being relegated will fall. Once the new constituents have settled in, a minor sell off tends to occur and those ejected do the opposite.

The reason it happens is because the funds have to buy the new entrants and sometimes (always) they get carried away. Besides, because the old market hands are aware of it, they simply buy the shares in the run up to the event. To qualify for inclusion in the FTSE a company has to be one of the 90 highest capitalised and to be excluded it must be 110 or more.

I hope this is better than nothing.
 
LION - you reasoning is sound and there is (was I should say) actually evidence to prove this for the FTSE at least - I remember when I was working in the inv.banking world a researcher I knew spent a lot of time putting together trading strategies based on this effect. Essentially you would have to take a view on what companies you thought would enter / leave an index and then do a basket spread trade. On average it was possible to make a good return doing this BUT obviosuly all its takes is for one element in the basket to be wrong or some other piece of fundamental news on another to throw this play off, plus as you stated funds take a view before the actual announcement!

will keep an eye out on google for sure!
 
We learn something new every day; I never thought of doing a "basket trade." Barring the bad fundamental news or something of the sort, it should smooth the returns out a bit. Thank you for that added information.
 
I have just copied this from CEEFAX.

$80BN GOOGLE TAKES TOP MEDIA SPOT

Internet search engine phenomenon Google has overtaken a swathe of venerable rivals to become the world's biggest media company by stock market value.
After its shares hit an all-time high on the New York markets on Tuesday, Google is now worth $80bn (£44bn).
This takes it ahead of media leviathan Time Warner, which is valued at $78bn.
The valuation comes in spite of the fact that Google's annual sales total just $3.2bn, a fraction of Time Warner's $42bn.
 
Google is positioned to exploit the most profit-rich avenues of the digital world. But can it really surge the way Dell and Cisco did in their glory days?

By Jon D. Markman

In a storybook sequence reminiscent of the late 1990s, brokerage analysts have tripped over each other in recent weeks to announce higher and higher price targets for online search provider Google (GOOG, news, msgs). With the stock now trading above $290, the analysts -- who are essentially, let’s face it, just doing their job as salesmen -- vow that it’s heading for $310, $350 or better.

Brokerages have joined the groundswell for Google to exploit one of the singular curiosities of the psychology of the stock market: They know that the higher the price of a stock goes, the more famous it becomes and the more people seem to want it. It’s the opposite of the way that sensible people run the rest of their lives, in which lower prices for cars and clothes spark buying interest.

In a world that blurs information and entertainment, Google has become as much a celebrity as it is a company, and has attracted the usual adoring crowd.

This time, however, the sell side may have a point. As Google has cleverly given employees great freedom to create and release software on the fly, it has tapped into creativity that has satisfied a yearning among consumers for transparency in the value and availability of things. More importantly, at the same time it has found brilliant ways to help marketing partners monetize that yearning without appearing greedy.

Nice guys and the holy grail
Although it has veered on the edge of annoying the privacy hounds with its innovation of posting highly targeted ads within its free e-mail service, the counterculture-tinged company may have discovered the Web’s holy grail, as originally imagined by the hippie capitalists behind the pioneering service Netscape. Google is as profitable as eBay (EBAY, news, msgs), as ubiquitous as Yahoo! (YHOO, news, msgs) and as service-oriented as Amazon.com (AMZN, news, msgs), yet still comes across as a nice guy in a tie-died shirt.

Maybe nice guys do finish first. Google has positioned itself in some of the most profit-rich avenues of the digital world and become as essential to our experience of life and work as personal computers and networking were two decades ago. It is not overstating the case to suggest that Google, though only a year old as a public company, might ultimately fulfill investors’ dreams to find “another” Dell (DELL, news, msgs) or Cisco Systems (CSCO, news, msgs) -- and possibly in record time.

This is much harder than it looks, and it does not look particularly easy. To be another Dell or Cisco, from now through the next 10 years it must achieve annualized net income growth of 20%. While its boosters in the brokerage community seem to think that is a piece of cake, due to its proven ability to roll out one well-imagined product after another, investors should keep in mind that many other outfits have likewise been crowned by the securities salesmen as the next Dell or Cisco, and come up short.

Online storage -- forever
The big difference in this case is that part of the genius of Google is its not-so-secret plan to become the online storage unit for virtually our entire lives, and perhaps well beyond the grave. The method for this is its free e-mail service, called Gmail, which has had a powerful impact even though it has not been officially released to the public. Still in widespread “beta,” Gmail currently provides two gigabytes of e-mail space to users free, and it has promised to add another gigabyte annually on the anniversary of its release. That is 200 times more storage than computers provided Dell customers in the early 1990s ramp-up of its business.

As you probably realize by now, pigeonholing Gmail as an e-mail service obscures the fact that, at a time that almost anything can be instantly sent to oneself or friends through online mail over broadband connections, it actually becomes the central repository of every important thought, document, photo or song that one has ever harbored or shared electronically. Combined with its easy search functionality, this has made Gmail a sort of essential “life cache” for its hundreds of thousands of early users. And this is subtly but profoundly monetized by the company with text ads so well-targeted via advanced text-parsing algorithms that they seem more like helpful hints than obnoxious intrusions.


To grasp the power of this business model, consider it in the context of that tired old phrase about the Internet being an information superhighway. As Google expands Gmail with personalized companion services -- such as maps, mobile-location guides and customized Web portals -- it is swiftly becoming the single most popular roadway in the world on which major corporate advertisers wish to post their billboards. This has put it in the sweet spot of the virtuous cycle for any media company, as user growth and usage growth have translated into increasingly higher advertising rates. The rise in revenues has fueled the company’s kitty for research and development, which has in turn fueled further engineering advances.

It is better to be lucky than good, and if you’re both -- watch out. Google’s targeted advertising strategy has come along at a time when global advertisers have finally decided, after several years of waiting and watching, that they need to shift a very significant portion of their marketing strategy onto the Web. And it has also come along at a time when online sales have exited launch phase and are well into blastoff. The industry says overall online sales in May were up 45% over a year ago and now regularly hit $1.5 billion per week.

Ad money flows in
The path to those riches for Google is only partly through its retail-sales comparison search engine, called Froogle. It’s primarily through the increase in prices advertisers are willing to pay to put their name next to the results of consumers’ searches on Google itself. According to a report by Fathom Online, as reported by an analyst at independent investment research firm First Global, keyword prices are up more than 9% this year above the Christmas holiday’s seasonally strong levels, to $1.75 per word. That is particularly significant, as a study by another industry research firm shows that most online buyers do a generic search for a product via a search engine before narrowing down their focus (e.g. “running shoes”, not “Adidas”). Each time one of those results is clicked on Google, it rings the cash register.

With ad budgets tight and global economic growth slowing, that kind of growth has drawn marketing money away from television, radio and newspapers, which is why traditional media giants such as Viacom (VIA, news, msgs), Clear Channel Communications (CCU, news, msgs) and Tribune (TRB, news, msgs) are struggling. Next to be affected are local Yellow Pages and smaller newspapers, as Google’s new “local search” engine is expected to generate as much as $4 billion in annual revenues by 2009.

This is one street that goes both ways. Just as marketers have shifted a significant portion of their ad purchases from traditional media to Google keywords, institutional investors have likewise shifted a big portion of their stock purchases to Google shares. At $80 billion, the company currently has a market value that’s half again larger than Clear Channel, Tribune, News Corp. (NWS, news, msgs) and The Washington Post (WPO, news, msgs) combined.

Now this is where the math gets tricky for new investors. For while it’s true that Google has performed extremely well fundamentally and shows no signs of slowing down, at a comparable period in their histories Cisco and Dell were much smaller companies. CreditSights pointed out in a note not too long ago that when those two companies had passed the threshold of $750 million in net income in a calendar year, as Google did in December 2005, they had had market caps 1.6 times and 3 times the average S&P 500 ($INX) technology stock at the time. Google’s market cap is now about 7.5 times the average S&P 500 tech stock. Moreover, Dell’s forward price/earnings multiple at that milestone was 9x, and Cisco’s was 16x. Google’s is more than 60x.

Google’s current valuation and future price targets are high because its past has been sterling -- capturing a stunning 57% of the entire search-engine market in 2004, by credible estimates -- and expectations are also high. It is at the very center of the most important trend to hit the modern lifestyle since the PC, and shows every sign of gaining ground. Dell and Cisco managed to avoid serious stumbles and defy their many skeptics at this stage in their histories, and make thousands of late-coming shareholders very wealthy.

Google could very well do the same -- though, because even more is expected of it than of its elders, its margin for error is much thinner. Go ahead and buy now if you believe, but beware that at these prices its most important search will be for the Fountain of Youth, for it must keep running at full speed and never, ever slow down to fulfill all those promises.

Fine Print
To see all the cool stuff that Google engineers have cooking, go to its Labs Web site. One is a MyMSN-like customized home page. Check it out here. ... There are lots of interesting blogs that follow Google. Here is its own.
 
LION63,

I suppose it is probably best to watch from the sidelines at present, the opportunity to short will come within the next 4 weeks or so and there will probably be at least a 20% correction. The problem is that those Wall Street analysts keep coming up with wilder valuations and the lumps pile in.

Your "feeling" that GOOG could retrace some 20% based on some factors mentioned regarding weighting of portfolios by mutual funds etc, got me interested enough just to analyse GOOG on a Fundamental basis, disregarding all the hype, and fantastical growth forcast far into the future.

What is GOOG worth today? And, should the market break badly in the next two years, where would people like myself, value hounds, start thinking, hmmmmm, GOOG, a good buy?

Well, at $6.96

Before the outrage starts to bubble, remember LUCENT.
Spun off from AT&T, the research lab that powered everything in telecomm, at it's high, $86, I believe, at it's low, $0.46

cheers d998
 
Ducati998,

When ou are being tied to the stake and the flames are being lit, do not bother looking either side of you because I refuse to be burnt as a heretic.

I have never done the extensive sums on Google that you have done but I would tend to believe that the figure you came up with is based on cash flow, assets, earnings (clean as opposed to that crap called EBITDA), growth prospects etc. On that basis, even if you are wrong how wrong could you be? Maybe at most 50% out, even if one were to be generous and give it another (premium) of 50% it still comes to a toppy price of $20. That is a fall of 93% from the current silly price that people are tripping over their laces to pay.

How can this company be worth more than Disney, News Corp or TimeWarner? Remember the gogo days of the tech stocks? AOL was going to change our lives forever and reach a market capitalisation of $1 trillion, in order to achieve this they merged (bought) Time Warner in the biggest deal of its kind. How much is it worth now? Are revenues rising at anything close to previous predictions? Where is the shareholder value that was going to be created from this mega merger? The only losers were the fools that bought the Utopian dream the investment bankers sold and now they face the ignominy of being hived off from Time Warner as a failed venture even the name has been dropped and all the executives have been put out to pasture.
 
LION63,

How can this company be worth more than Disney, News Corp or TimeWarner? Remember the gogo days of the tech stocks? AOL was going to change our lives forever and reach a market capitalisation of $1 trillion, in order to achieve this they merged (bought) Time Warner in the biggest deal of its kind. How much is it worth now? Are revenues rising at anything close to previous predictions? Where is the shareholder value that was going to be created from this mega merger? The only losers were the fools that bought the Utopian dream the investment bankers sold and now they face the ignominy of being hived off from Time Warner as a failed venture even the name has been dropped and all the executives have been put out to pasture.

The GoGo days,..........1927 - 1929, 1962 -1968, 1994 - 1999, ...............................

But some interesting owners;

Mutual Fund Shs Held Shs Chg %Chg $Chg* %Out %Port Rpt Date
Growth Fund Of America, Inc 5,272,100 5,272,100 0.0 976,287,424 1.9 0.0 02-28-05
Fidelity Growth Company Fund 2,782,448 525,000 23.3 97,219,496 1.0 0.0 02-28-05
Legg Mason Value Trust, Inc 2,100,000 2,098,000 104,900.0 404,704,192 0.8 0.0 12-31-04
Fidelity Contrafund 1,317,936 1,317,936 0.0 254,229,840 0.5 0.0 12-31-04
Vanguard Total Stock Market Index Fund 1,044,315 113,878 12.2 21,967,066 0.4 0.0 12-31-04
Fidelity Magellan Fund 848,000 848,000 0.0 163,579,200 0.3 0.0 12-31-04
Vanguard Extended Market Index Fund 681,232 110,774 19.4 21,368,304 0.2 0.0 12-31-04
New Economy Fund 575,000 75,000 15.0 13,888,499 0.2 0.0 02-28-05
Cref Growth Account 565,519 146,131 34.8 28,188,670 0.2 0.0 12-31-04
Amcap Fund, Inc 500,000 -50,000 -9.1 -9,259,000 0.2 0.0 02-28-05
Fidelity Disciplined Equity Fund 463,100 463,100 0.0 88,868,888 0.2 0.0 01-31-05
Prudential Jennison Growth Fund 438,700 236,300 116.7 45,582,268 0.2 0.0 12-31-04
Fidelity Blue Chip Growth Fund 424,800 0 0.0 0 0.2 0.0 01-31-05
Variable Insurance Products Contrafund Portfolio 383,343 383,343 0.0 73,946,864 0.1 0.0 12-31-04
Alliance Premier Growth Fund, Inc 327,000 327,000 0.0 62,751,300 0.1 0.0 01-31-05
Institution Name Shs Held Shs Chg %Chg $Chg* %Out %Port Rpt Date
Capital Research & Management Co 13,452,299 8,031,599 148.0 1,383,217,792 4.8 0.6 03-31-05
Fidelity Management & Research Co 11,956,967 3,424,040 40.0 513,289,120 4.3 0.4 03-31-05
Alliance Capital Management 6,420,024 3,684,610 135.0 631,518,080 2.3 0.5 03-31-05
Jennison Associates 5,196,777 1,096,525 27.0 147,582,640 1.9 2.1 03-31-05
Goldman Sachs Asset Management 4,840,409 2,763,538 133.0 473,342,272 1.7 0.6 03-31-05
Legg Mason Fund Advisors 4,830,227 87,883 2.0 -42,372,224 1.7 1.9 03-31-05
Barclays Global Investors Intl 3,786,822 2,516,599 198.0 438,672,960 1.4 0.1 03-31-05
Sands Capital Management 3,346,185 3,346,185 100.0 604,019,840 1.2 4.9 03-31-05
Rcm Capital Management 2,597,898 1,439,330 124.0 245,586,240 0.9 2.5 03-31-05
Wellington Management 2,432,614 2,253,634 1,259.0 404,605,600 0.9 0.2 03-31-05
Lone Pine Capital Llc 2,409,033 1,806,577 300.0 318,707,040 0.9 6.0 03-31-05
Morgan Stanley Investment Management 2,348,739 2,069,118 740.0 370,062,752 0.8 0.4 03-31-05
Sequoia Capital 2,185,537 2,185,537 100.0 394,511,296 0.8 100.0 03-31-05
Vanguard Group 1,996,598 48,545 2.0 -15,159,233 0.7 0.1 03-31-05
T Rowe Price Associates 1,704,272 822,102 93.0 137,564,576 0.6 0.2 03-31-05


T.Rowe Price & Sequoia are, or were once upon a time "Value" investors. I wonder if the original managers are still there? ( Michael Price, & Bill Ruane )

And the 5% or greater owners;

Holder Name Shs Held $ Market Value %Out Fully Diluted Shs Rpt Date
Page ( Larry ) 37,710,784 7,270,261,760 13.6 37,710,784 12-31-04
Brin ( Sergey ) 37,607,436 7,250,337,280 13.5 37,607,436 12-31-04
Moritz, Michael 23,893,800 2,587,937,536 8.6 23,893,800 08-20-04
Doerr, L. John 21,043,712 2,279,244,288 7.6 21,043,712 08-20-04
Sequoia Capital 16,747,926 3,228,832,768 6.0 16,747,926 12-31-04
Schmidt, Eric 14,389,635 1,558,541,312 5.2 14,389,635 08-20-04

cheers d998
 
Analyst Ratings
Recommendations...... Current .........1 Month Ago.... ............2 Months Ago ..............3 Months Ago
Strong Buy .........................11 ......................11 ...................................10...................................... 9
Moderate Buy..................... 6 ........................4 ......................................3....................................... 2
Hold .....................................4 ........................4 ......................................5....................................... 7
Moderate Sell.................... 0........................ 0...................................... 0....................................... 0
Strong Sell......................... 0 ........................0 ......................................0....................................... 0
Mean Rec........................ 1.67................. 1.63................................. 1.72 ..................................1.89


Mean Recommendation Conversion Table 1.0 = Strong Buy
1.1 thru 2.0 = Moderate Buy
2.1 thru 3.0 = Hold
3.1 thru 4.0 = Moderate Sell
4.1 thru 5.0 = Strong Sell


And there you have the Wall St concensus.............BUY IT BABY!
cheers d998
 
Did I really see a fund in that list called Fidelity Disciplined Fund or did you sneak that one in to see if anyone was paying attention? In the days when Peter Lynch ran the Magellan Fund for Fidelity he would not have considered holding at anywhere near these levels, no wonder the Fund has been a very poor performer over the last few years.

In fairness, most of them bought in when it was much less than $200 and they are sitting on tidy profits. Unless I am missing something though, in the old days it used to be a case of once shares got way ahead of events, they were sold and one looked for other "dogs" or growth stocks. I suppose now that the computers do all the work, investors (at least they pretend to be) do not stop to think and/or they are a bunch of incompetents.
 
LION,

No that list is legitimate, I was surprised at many of the names on it. Makes you wonder, if they start taking profits what might happen?

cheers d998
 
Lion63,

And of course, the insiders, they can be an early warning on occasion. Look at all the selling. No-one seems to be very interested in buying at these current prices............duh!

Recent Insider Trading Activity: Google Inc.
Date Name .............................Transaction...................... Num Shares ......................Price(s) Value
06/03/05 REYES GEORGE ......Sold ....................................7,610 ..........................$283.86 2.16 Mil
06/03/05 ROSENBERG JONATHAN J Sold .......................9,860.......................... $284.02 2.80 Mil
06/02/05 REYES GEORGE.... Sold ......................................4,563.......................... $288.25 1.32 Mil
06/02/05 REYES GEORGE.... Sold...................................... 3,045 ...................$286.32 871,844.38
06/02/05 ROSENBERG JONATHAN J Sold....................... 6,312 .........................$288.23 1.82 Mil
06/02/05 ROSENBERG JONATHAN J Sold .......................3,546 .........................$286.07 1.01 Mil
06/01/05 REYES GEORGE... Sold .......................................4,872......................... $285.65 1.39 Mil
06/01/05 ROSENBERG JONATHAN J Sold....................... 3,646......................... $290.14 1.06 Mil
06/01/05 ROSENBERG JONATHAN J Sold....................... 6,212........................ $285.69 1.77 Mil
06/01/05 KORDESTANI OMID Sold ...................................53,546 ......................$287.58 15.40 Mil
06/01/05 KORDESTANI OMID Sold ...................................49,295 ......................$285.08 14.05 Mil
06/01/05 REYES GEORGE Sold ..........................................2,736 ..................$290.20 793,987.19
06/01/05 DRUMMOND DAVID C Sold.............................. 40,100...................... $284.24 11.40 Mil
06/01/05 KORDESTANI OMID Sold ..................................37,915...................... $291.21 11.04 Mil
06/01/05 KORDESTANI OMID Sold ..................................34,453........................ $288.93 9.95 Mil
05/31/05 BROWN SHONA L Sold ........................................2,541................. $274.05 696,348.38
05/26/05 SCHMIDT ERIC E Sold .........................................3,570................. $263.07 939,159.88
05/26/05 SCHMIDT ERIC E Sold......................................... 3,770 .................$261.86 987,193.38
05/26/05 SCHMIDT ERIC E Sold......................................... 6,940 ........................$261.20 1.81 Mil

Insider filings are updated daily and are based on forms filed monthly with the SEC.

Cheers d998
 
Top