Getting Set To Move Higher

Harmonic Grid Example

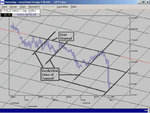
I hope you can see a daily chart for Cable & Wireless.
THe system indicated a Buy signal on Thursday last week at 67p with a Stop the other side of the upward sloping support line at 62p and a Target up at the next upward sloping line at 116p. Stops and Targets rise dynamically by around 1 1/2 pence each day.

A Bear Channel is defined by the area between 2 downward sloping lines.

A Bull Channel is defined by the area between 2 upward sloping lines.

More info is available on the site.
 
get your file in .jpg format, no bigger than 800x600 pixels, nominal. Then save it on your HDD ( desktop). when you do a "reply" at the bottom is a box that has browse by the side of it . Click that and browse to your desktop and click on the file you want.Then hit submit reply.
 
chartman
thanks i did exactly that except it was in .gif format. Will try now with jpeg
Thanks again
 
Cable & Wireless Daily Chart

Hope this works
 

Attachments

  • cable & wireless daily chart 18th november 2002.jpg
    cable & wireless daily chart 18th november 2002.jpg
    62.5 KB · Views: 689
bigblue,

yeh - glad to have u come to this site
u predicted enron and some other companies going bust didn't u?
I think in your old site, u also said verisign should be going bust?
When will the new site have a tour we can take of current predictions?

Thanks for the chart....
 
Hopefully the site will be ready very shortly. I did get Enron right together with Adelphia and Worldcom but there have been some fantastic calls to the upside as well. For example I called Coffee in the summer at 470, now 820, going to 2000. 180 day old case studies are on the registered user part of the site as I write this, feel free to browse.
 
thx for the advice neil and chartman much appreciated, i am new to this site, but not to the markets i am a full time proffesional and i listen to all views but solely act on my own and take full resposibilty for my actions. neil i do not think there is going to be a breakout as i said and i am trading what i see accordingly i was just sharing my views with you all but again i thku both for reminding me of the pitfalls one can fall into. warmest regards.
 
Looking good so far

Market (S&P 500) needs to take out 917 conclusively and we will have broken out to the upside. The support held firm at 893. As long as that holds, we are going to have another good run up.
:D
 
Not quite..... I see all lthe major support /resistance lines sitting on the 5's and 0's. I would say 915 has to hold as 917 is just "floating in mid air"......That's not to say it won't/can't bounce off 917, I would just think 914.5 is a better long stop.
 
I just meant that a break of 917 on S&P would constitute a break out to the upside, using my analytical method.
Market looks great, should continue much higher.
Hope the bears changed their minds!
 
Rally to peak early December.. 6th?
and then sideways for a while.
S&P to around 960.. lots of resistance there...

Well that's my guesstimate
 
Top