Newtron Bomb
Guest Author
- Messages
- 1,602
- Likes
- 87
Freebie Trend Following Strategy
The First thing that needs to be said is that this is only the basic outline of the full strategy that I use. As with most areas of trading there is a larger element of judgement. The second thing is that there is no sure-fire way of trading to make a fortune overnight. If you are looking for that then try the lottery.
In essence it is a simply the price crossing a moving average entry. Long above, short below. This is nothing new and can be found in many textbooks. I currently only trade this on a long only basis. It can be traded on Long or short only or both together. The way I will explain will be the latter and therefore always in the market using a stop and reveres strategy. Please note there are certain times when I do not trade at all these are elements that I am not explaining, as they are mostly judgement calls and as such vary from person to person. They are not relevant to what I am trying to demonstrate.
I trade this using 15minute charts and a 100ema. I believe you can trade this method with any time frame from 1-minute charts for day trading and upward, although I have only traded this way with 15-minute charts.
Entry & Exit
When the price touch’s the MA add 20 points above for a long and 20 points below for a short. Your stop and reverse point is 40 points behind your every entry. Your risk per trade is therefore 40 points max per entry and then a 20-point trailing stop and reverse behind the 100ema…. The way the most benefit can be gained is by scaling in to the position.
It is really a no brainer and that is the way I like it, it is not efficient as you can maximise the trades more but this way on its own even trading long only as I am doing now is giving me very pleasing results. The way that I use this is through CMC so that I can scale in at smaller increments than a full size contract. When I change over to trade this both long and short I intend to trade it as follows. (As it stands at the moment I do precisely the same but for long only.)
My entry has been defined at the ema +/-20. I have orders waiting every 75 points past my entry (50 has been too whippy and 100 is too far away, I have traded all three) and I will have a stop 40 points behind my entry or a reverse 20 points below the MA whichever comes first. I usually have 4 entries waiting plus my stop and reverse point. I do not move the stop & rev point down/up if the MA moves down/up. (So far this has not been a problem.) NOTE: if the stop is hit I wait for the reverse point to renter either way it will be +/- 20 ema or +/- 75 points if adding to the position.
When the stop and reverse is triggered I close out the full position and reverse by my smallest starting stake, this reduces the amount off losses when it whips around the MA. This does not actually happen that often.
The only addition thing to mention is that it is a 24 hour market and over night I have not noticed a significant size move. I normally put my stop on the MA and leave overnight, I have a text alert set up so that when an entry is executed I will know within 5 minute wherever I am and adjust my stop order with cmc over the telephone. If I am asleep then I deal with it in the morning not usual a lot has happened by 730am. For my example am using 630pm as my cut off time to put the overnight stop on the ema. If the price is before the ema the reversal stop is left in place. For the purpose of this example no trades have been placed between 630pm and 8am the following morning as it would be cheating to say what I may or may not do that can not be quantified with a rule, plus what is the reality of you being in front a trading screen 24 hours a day!!!
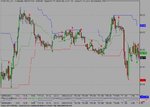
I have read and reread this a dozen or more time and am still not sure if I have explained this to well so I think an example is now called for. I’ve just picked last week as that was all that could fit full screen on my sierra charts so no one can accuse me of fitting… check the dates or pick a random date to see it in action for yourself.
The dates are the 20th to the 29th August in the year of our lord 2003
Visually (see chart) you can see that this method of trading can be profitable, as long as you scale in.
We will start this at a sensible time and conveniently an entry presented itself when we had a pullback to the ema just before 8am @ 1.5892 our entry is just after 8am +20ema #1@ 1.5912
#1 Long 1.5912
#2 Short 1.5885
#3 Long 1.5925
#4 Short 1.5920
#5 Short 1.5845
#6 Short 1.5770
#7 Long 1.5770 reverse triggered overnight
#8 Short 1.5761
#9 Short 1.5686
#10 Long 1.5721 price below ema so leave stop at reversal price not triggered
#11 Short 1.5682
#12 Long 1.5720 (trade after 8am)
#13 Short 1.5687 reversal stop left and triggered over night
#14 Long 1.5715
#15 Long 1.5790
#16 Short 1.5752 open @1.5775
Points
#1 -27
#2 -40
#3 -5
#4 150
#5 70
#6 0
#7 -9
#8 40
#9 35
#10 -40
#11 re-entry
#12 -38
#13 -33
#14 37
#15 -38
#16 -23 still open
Total points +32 excluding trade #16 as is still technically open.
In reality trading with cmc trade #2 & therefore #3 (spike down) did not actually execute due to cmc’s bazaar order execution system and is more often than not in your favour in this type of instance. On the same note #11 would most probably have not been executed for a similar reason but as I did not trade the short side I can not say for definite, but in the past this type of touch and go entry does not get executed with cmc.
Additional notes for maximising profit.
There are a variety of methods that can be applied to this basic strategy to get the most out of the trades. But as you can see from this, albeit small, example it is very pleasing to the pocket book. You can look for divergences to signal a top or a bottom with the indicator of your choice. With this time frame a two-peak divergence with a 14 period RSI is common. I usually look for Patterns to add to a position and support and resistance…. This is all basic TA stuff but on cable it really does work but as with any market it need a fair bit of time and energy to get the most out the analysis.
On another note I used to day trade something similar on the Ibex with 1 min and 5 min charts when the ranges were regularly 150/200 in a day this year has not seen those ranges so I have had to put day trading the ibex aside. I trade something similar on the Euro/Dollar & Gold. And also the FTSE Dax and Ibex futures on 15 min charts but there are issues with gapping on the futures that needs more attention that what I have explained here.
Enjoy :cheesy:
Edit:
The errors have hopefull been fixed and the figures and typos too
Its not a dramatic result but for a no brainer it is giving me some money in the bank :cheesy:
The First thing that needs to be said is that this is only the basic outline of the full strategy that I use. As with most areas of trading there is a larger element of judgement. The second thing is that there is no sure-fire way of trading to make a fortune overnight. If you are looking for that then try the lottery.
In essence it is a simply the price crossing a moving average entry. Long above, short below. This is nothing new and can be found in many textbooks. I currently only trade this on a long only basis. It can be traded on Long or short only or both together. The way I will explain will be the latter and therefore always in the market using a stop and reveres strategy. Please note there are certain times when I do not trade at all these are elements that I am not explaining, as they are mostly judgement calls and as such vary from person to person. They are not relevant to what I am trying to demonstrate.
I trade this using 15minute charts and a 100ema. I believe you can trade this method with any time frame from 1-minute charts for day trading and upward, although I have only traded this way with 15-minute charts.
Entry & Exit
When the price touch’s the MA add 20 points above for a long and 20 points below for a short. Your stop and reverse point is 40 points behind your every entry. Your risk per trade is therefore 40 points max per entry and then a 20-point trailing stop and reverse behind the 100ema…. The way the most benefit can be gained is by scaling in to the position.
It is really a no brainer and that is the way I like it, it is not efficient as you can maximise the trades more but this way on its own even trading long only as I am doing now is giving me very pleasing results. The way that I use this is through CMC so that I can scale in at smaller increments than a full size contract. When I change over to trade this both long and short I intend to trade it as follows. (As it stands at the moment I do precisely the same but for long only.)
My entry has been defined at the ema +/-20. I have orders waiting every 75 points past my entry (50 has been too whippy and 100 is too far away, I have traded all three) and I will have a stop 40 points behind my entry or a reverse 20 points below the MA whichever comes first. I usually have 4 entries waiting plus my stop and reverse point. I do not move the stop & rev point down/up if the MA moves down/up. (So far this has not been a problem.) NOTE: if the stop is hit I wait for the reverse point to renter either way it will be +/- 20 ema or +/- 75 points if adding to the position.
When the stop and reverse is triggered I close out the full position and reverse by my smallest starting stake, this reduces the amount off losses when it whips around the MA. This does not actually happen that often.
The only addition thing to mention is that it is a 24 hour market and over night I have not noticed a significant size move. I normally put my stop on the MA and leave overnight, I have a text alert set up so that when an entry is executed I will know within 5 minute wherever I am and adjust my stop order with cmc over the telephone. If I am asleep then I deal with it in the morning not usual a lot has happened by 730am. For my example am using 630pm as my cut off time to put the overnight stop on the ema. If the price is before the ema the reversal stop is left in place. For the purpose of this example no trades have been placed between 630pm and 8am the following morning as it would be cheating to say what I may or may not do that can not be quantified with a rule, plus what is the reality of you being in front a trading screen 24 hours a day!!!
I have read and reread this a dozen or more time and am still not sure if I have explained this to well so I think an example is now called for. I’ve just picked last week as that was all that could fit full screen on my sierra charts so no one can accuse me of fitting… check the dates or pick a random date to see it in action for yourself.
The dates are the 20th to the 29th August in the year of our lord 2003
Visually (see chart) you can see that this method of trading can be profitable, as long as you scale in.
We will start this at a sensible time and conveniently an entry presented itself when we had a pullback to the ema just before 8am @ 1.5892 our entry is just after 8am +20ema #1@ 1.5912
#1 Long 1.5912
#2 Short 1.5885
#3 Long 1.5925
#4 Short 1.5920
#5 Short 1.5845
#6 Short 1.5770
#7 Long 1.5770 reverse triggered overnight
#8 Short 1.5761
#9 Short 1.5686
#10 Long 1.5721 price below ema so leave stop at reversal price not triggered
#11 Short 1.5682
#12 Long 1.5720 (trade after 8am)
#13 Short 1.5687 reversal stop left and triggered over night
#14 Long 1.5715
#15 Long 1.5790
#16 Short 1.5752 open @1.5775
Points
#1 -27
#2 -40
#3 -5
#4 150
#5 70
#6 0
#7 -9
#8 40
#9 35
#10 -40
#11 re-entry
#12 -38
#13 -33
#14 37
#15 -38
#16 -23 still open
Total points +32 excluding trade #16 as is still technically open.
In reality trading with cmc trade #2 & therefore #3 (spike down) did not actually execute due to cmc’s bazaar order execution system and is more often than not in your favour in this type of instance. On the same note #11 would most probably have not been executed for a similar reason but as I did not trade the short side I can not say for definite, but in the past this type of touch and go entry does not get executed with cmc.
Additional notes for maximising profit.
There are a variety of methods that can be applied to this basic strategy to get the most out of the trades. But as you can see from this, albeit small, example it is very pleasing to the pocket book. You can look for divergences to signal a top or a bottom with the indicator of your choice. With this time frame a two-peak divergence with a 14 period RSI is common. I usually look for Patterns to add to a position and support and resistance…. This is all basic TA stuff but on cable it really does work but as with any market it need a fair bit of time and energy to get the most out the analysis.
On another note I used to day trade something similar on the Ibex with 1 min and 5 min charts when the ranges were regularly 150/200 in a day this year has not seen those ranges so I have had to put day trading the ibex aside. I trade something similar on the Euro/Dollar & Gold. And also the FTSE Dax and Ibex futures on 15 min charts but there are issues with gapping on the futures that needs more attention that what I have explained here.
Enjoy :cheesy:
Edit:
The errors have hopefull been fixed and the figures and typos too
Its not a dramatic result but for a no brainer it is giving me some money in the bank :cheesy:
Attachments

Last edited: