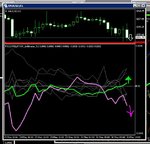
Fxcorrelator_goldmeter

so if Yen has dropped over 20% of its value since Nov 11 and many others are in negative territory............and AUD is only +10%

where'd all de money go ?


Good question, to which I don't have an answer except the money has helped float the DJIA,S&P,DAX,FTSE etc.

Yield on the 10 year T note has risen quite substantially over the past 11 weeks and had a big 25%+ swing. Surely they don't want that to continue?
 
i still dont know how to use the fx correlator goldmeter. can someone help ?

do you wait for the violet line to go either side extreme, say if it goes above to the top. it reaches the peak, then you buy ?
 
Did you read this, from the first page?

FXCORRELATOR - GOLDMETER

Gold is on the march again

here is one of my (simpler) approaches to Trading Gold....never published here before ....
so have it as a present as I think it will be very very useful as Gold fires up !

open up this indicator and lay it on the XAU/USD chart

whenever the Violet line gets above or below all the other lines - trade it !

I use 20ma as a default like my standard FXcorrelator and thats a 20 sma on the XAU gold chart itself....the 2 bold lines will always crossover where the chart crosses the 20 sma if you keep the same ma setting.....

Background

this is Gold priced relatively to the other currencies.......when it gets above them all then the market is deeming to be losing faith in paper money and moving away from Fiat currencies - and vice versa for the other direction traded

the Green line is the USD .....Ideally I would like to see the USD diverging and falling
as the Violet (Gold) line goes above all the lines re a signal ...and vice versa

research Gold to see why i like this as a strategy....simple relative strength applications to trading

thats it ......enjoy !
NVP
Attached Thumbnails
fxcorrelator-_-goldmeter.jpg
Attached Files
File Type: mq4 FXCORRELATOR_Goldmeter_V2.mq4 (4.3 KB, 243 views)


i did. but i still dont get it. when to enter buy and when sell ?
 
i did. but i still dont get it. when to enter buy and when sell ?

hey dude

simplest ?

trade the violet line when it is on the opposite side of the zero to the Green line......and preferably both are diverging

violet below zero = sell XAU/USD....and vice versa

theres more options but this is the simplest :smart:
N
 
hey dude

simplest ?

trade the violet line when it is on the opposite side of the zero to the Green line......and preferably both are diverging

violet below zero = sell XAU/USD....and vice versa

theres more options but this is the simplest :smart:
N
re occasions

yes, but there are many occasions when violet line is below zero and opposite to the green line, where if trade taken it would have gone the other way i.e. stopped out. as can be seen from your chart examples in post # 97.

how would you filter those bad trades ?
 
No-one knows what is going to happen. This can only ever give you a better chance of getting the direction right. Within any timeframe you use, the price will always go up and down, so it depends how tightly you set your stops.

If someone had a method that catured every move correctly, they'd be multi billionaires.

Longer trades are generaly easier to get right as the cycles are more predictable?

Hey FT

as traders we cannot predict how right or wrong our trades are .....

We pick a signal, trade it and then try to optimise the exit strategy
We use a sensible MM approach so we minimise unnecessary losses

and we hope that the results will gradually turn profitablity onto our side as the sample size increases.......the sample size is the key......you cannot tell if a system is profitable off a handful of trades..... and you need to embrace all market conditions as well to take the rough with the smooth and ensyre the sample is realistic.....

N :smart:
 
jees i havnt posted here for a year !

and the goldmeter (free below in links ) is still as strong and robust as its always been......

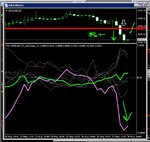
heres the dailys and the trade signals ........a couple of absolute peaches earlier in the year

use it on any timeframe .........simple rules utilising that when usd index is weak and gold is strong trade it (and vice versa)

N
 

Attachments

  • goldmeter daily signals.JPG
    goldmeter daily signals.JPG
    121 KB · Views: 243
poss sell alert on 1hrs....sell below 1249 could be interesting into the weekend

N
 

Attachments

  • sell gold.JPG
    sell gold.JPG
    74.8 KB · Views: 255
heres the 4hr TF ........

read up on the rules to understand the perfect trading conditions ...........a couple of nice signals are shown (y)

N:smart:
 

Attachments

  • goldmeter.JPG
    goldmeter.JPG
    104.7 KB · Views: 288
heres the week on the free goldmeter available below in the links area ...........

rules are there as well ...............

basically we pounce when absolute gold price (in relative terms) is the most strongest or weakest to all G8 currencies ..........and usd is moving in opposite direction

then trade XAU/USD...........

can anyone spot the big trade ?.............its not hard is it !!! :cheesy:

N
 

Attachments

  • goldmeter signals.JPG
    goldmeter signals.JPG
    97.1 KB · Views: 316
mainly selling on Gold...........not surprising given the usd bull posture

this indicator is available for free below in the links area and the trading system as well

N
 

Attachments

  • goldmeter trading.JPG
    goldmeter trading.JPG
    157.3 KB · Views: 313
hey Nlenz .............you dont know Gadi do you ?

gg53 ?

hes a greeeat trader I work with in Israel

N

Do you know what happened to his thread "Fractals, ZZ & the Pissing Dog" @ FF?
I heard he opened a private forum and shared the Arrow indicator. Do you know where to find /join it?
 
Top