barjon
Legendary member
- Messages
- 10,752
- Likes
- 1,863
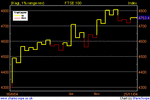
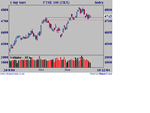
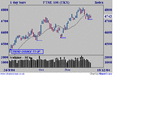
Kagi goes bearish 😱 mmm, still got that potential support level to break imo.
This thread's gone awfully quiet of late, there must be some of you still trading ftse or have you all deserted to forex.
good trading (even if it's on forex 🙄 )
jon
This thread's gone awfully quiet of late, there must be some of you still trading ftse or have you all deserted to forex.
good trading (even if it's on forex 🙄 )
jon