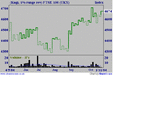
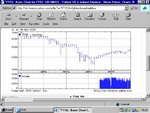
FTSE100 - November 2004

barjon

Legendary member
Messages
10,752
Likes
1,863
You guys gone into hiding then?

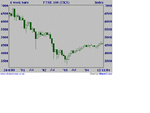
I see the negative candles gave a bit to you beary boys whilst I was away - hope your pockets are jingling - and now we seem to have stalled at the resistance line. Bounce over or will we break through and continue the climb? Time (and US president) will tell all - think I'll unpack before venturing in.

good trading

jon
 

Attachments

  • ftse.gif
    ftse.gif
    11.5 KB · Views: 379
barjon said:
You guys gone into hiding then?
I see the negative candles gave a bit to you beary boys whilst I was away - hope your pockets are jingling - and now we seem to have stalled at the resistance line. Bounce over or will we break through and continue the climb? Time (and US president) will tell all - think I'll unpack before venturing in.
jon

Hi Jon - welcome back.

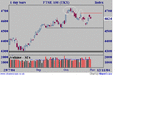
Difficult to argue from the charts that the trend is not still firmly up from the August Lows really - and the March 03 low too.

Still think 4732 will turn out top for the forseeable future though - but not brimming with confidence about it - yet.

Best recent trades all long! Small short opened at 4670 this pm though. We'll see.
 
barjon said:
You guys gone into hiding then?

I see the negative candles gave a bit to you beary boys whilst I was away - hope your pockets are jingling - and now we seem to have stalled at the resistance line. Bounce over or will we break through and continue the climb? Time (and US president) will tell all - think I'll unpack before venturing in.

good trading

jon
Hello barjon

Nice to see you back, I trust you had a pleasant break.

I have not been trading the ftse index for some weeks. I am in the process of developing my price/volume skills using dbphoenix files and readind/posting on 'strategy development' thread but don't hold your breath whilst I do so otherwise you may depart for longer than you would like.

I read at the weekend that Shell are applying to the appropriate authorities to increase their ftse capitalisation to cover the whole of the company. I think only the transport and distribution side are included currently. This would raise their % of the ftse from 3% to 8%, further concentrating the ftse into a banking,oil & phamaceutical sector index.

I know that mully thought that the ftse was no longer a useful index to trade because of the effect a few companies could make. The Shell proposal appears to reinforce the mully view.

Regards

bracke
 
Last edited:
peter - good to hear your bearish goggles didn't blot out the bull's footprints then :LOL:

bracke - did you ever get that Wykcoff book? - I'll lend you mine if you pm.
not sure that the concentration of a few companies makes ftse less tradeable - should make it more volatile even if it is a bit less representative of what's happening
to businesses overall

both - the monthly (don'cha just luv that doji signal of the bottom!!) shows the trend and that we could do with getting back to the volatilty of pre 03.
 

Attachments

  • ftsem.gif
    ftsem.gif
    9 KB · Views: 342
FTSE 100 November

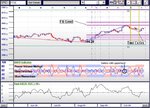
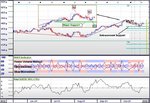
Quick Update on FTSE.

Election period & outcome of it can be very indecisive time for stock market.

Open your position with stop lose to protect your capital
 

Attachments

  • 3.jpeg
    3.jpeg
    82.6 KB · Views: 422
  • 4ok.jpeg
    4ok.jpeg
    75.1 KB · Views: 363
barjon said:
peter - good to hear your bearish goggles didn't blot out the bull's footprints then :LOL:

bracke - did you ever get that Wykcoff book? - I'll lend you mine if you pm.
not sure that the concentration of a few companies makes ftse less tradeable - should make it more volatile even if it is a bit less representative of what's happening
to businesses overall

both - the monthly (don'cha just luv that doji signal of the bottom!!) shows the trend and that we could do with getting back to the volatilty of pre 03.

barjon

Have not got book yet as reading and noting my way through tjhe dbphoenix files. There is a lot to take in and retain. I will read the Wykcoff book once I have worked through the files. I think the library can obtain it for me, if not I will take you up on your kind offer

Perhaps the volatilty which you crave will occur after the US election and/or the UK election are out of the way. On the other hand we may see the bear wreaking havoc ( I am sure peterpr is secretly longing for the day ).

What is a bozo in charting terms ? I saw it mentioned recently but looked on a number of sites but could find no reference to it.


Regards

bracke
 
barjon said:
both - the monthly (don'cha just luv that doji signal of the bottom!!) shows the trend and that we could do with getting back to the volatilty of pre 03.

Cracking signal - isn't hindsight a wonderful thing? - or maybe you traded off it?

But the most startling thing about that chart is the volatility. I can't check it back before mid 2000 so not sure of its significance (if any). Seems to imply lack of conviction either way though.

Any thoughts?
 
DoubleSix said:

DoubleSix

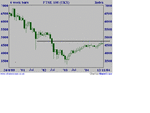
I am not quite clear on the point you are making.

I understand you are showing a resistance level but what is the relevance of the candle to the far left. Are you suggesting it is more than coincidental ?

Regards

bracke
 
Buy on Yang, Sell on Yin

For your edification and delight. The 1% Kagi line changed from thin to thick (yin to yang) with yesterday's move. A buy signal by golly - that should cause stirrings in the bear camp :LOL:

Don't use it myself - just one of sharescope's new toys I've been playing with.

good trading

jon
 

Attachments

  • ftsek.gif
    ftsek.gif
    9.8 KB · Views: 334
Let's hear it for Kagi then (+66 so far)!!!!

Where's everybody gone? From a TA perspective can anyone see any resistance 'til beyond 5000?

good trading

jon
 
barjon said:
Let's hear it for Kagi then (+66 so far)!!!!

Where's everybody gone? From a TA perspective can anyone see any resistance 'til beyond 5000?

good trading

jon

Hello barjon

I know b all about Kagi, other than landing in it from time to time.

Been looking at the charts and had to go to a 5 year to see where resistance might occur.
Seems ridiculous but your 5000 appears to be it.

I ask myself will it get there under its own steam ( one gets an excellent level of conversation talking to oneself ) and the reply was, what is there to raise it to that level, to which I replied investor exuberance.

Further conversation with myself concluded that all things are possible but ftse would probably need a leg up from the US to get to 5000.
If US falls can ftse resist the gravity that would be created ?

At this point men in white coats arrived to administer medication, not because of the wonderful conversation I was having with myself but because I thought it possible that ftse could go to 5000 !

Regards

bracke
 

Attachments

  • untitled.jpg
    untitled.jpg
    65.8 KB · Views: 294
Looking at the data from most recent highs and lows.....

Support : 4551.6
Trend Support : 4528.1
-----------------------------
Trend Resistance : 5282.02
Recovery Resistance: 5082.7
 
Well friends, I was very bearish on this thread (still am), so just thought of letting you guys know what happened to my short positions.

I have closed the lot when the market settled down after the initial post-election rally. I have closed all the positions (which I opened at various points ranging from 4400 to 4660) around 4710. I decided to take the hit when the market started to show the sign that I'd be in serious trouble if I didn't close the lot.

I have lost some money, not crippling, but still a loss fairly larger than I'd normally take. I let the losses grow larger because I was extremely confident of what I was doing.

I have concluded that my timing has been entirely wrong. Whether my market analysis has also been wrong (i.e., if I have been wrong being bearish) only future will tell.

Sod's law says now that I have covered my shorts, the market should now crash.

One more point to add in my Lessons Learned Log.
 
Haven't got a specific resistance level in mind myself - just can't see anything until that congestion area at (5000 and beyond) that bracke points up.

rajpatel - be interested to know how you get to your 5082.7 recovery resistance figure?


prtbh

commiserations regarding the hit - can't remember if you use stops? When will you think Mr Sod has come out to play - I'll need a break below 4550 to change trend to down.

good trading

jon
 
Jon,
My opinion: the current support is at 4540-4560 region (tested in late Sept and late Oct), so any break below that on high volume should indicate a bearish sign.
 
DoubleSix said:
bracke
you work it out
you shouldnt be so half-hearted

lol

DoubleSix

If its something to do with waves or fibonacci or similar so be it. I avoid such TA and indicators although I appreciate that many follow them....but thats another conversation which I will not get into.

Certainly not half-hearted, merely a realist with bearish leanings.

So come on stop holding us in suspense and divulge the origination of 5114.

Regards

bracke
 
Top