FTSE100 - November 2004

barjon said:
Let's hear it for Kagi then (+66 so far)!!!!
Where's everybody gone? From a TA perspective can anyone see any resistance 'til beyond 5000?
jon

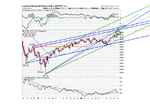
I've been playing with precious metals whilst footsie resolves it's battle with the 4735/40 resistance line. Only one convincing daily close above it so far but it certainly looks like today will confirm the break. The 250 has already done so and the US indices are beginning to pose problems for the bear case.

Can't see any serious resistance before 5000'ish either. My guess is that it will continue climbing the usual 'wall of worry'. But with so many macro-fundamentals continuing to deteriorate it shouldn't take much to turn 'worry' into something less supportive.

Jon

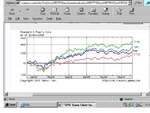
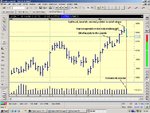
The Kagi charts are interesting. I've been doing a bit of back-testing (tedious long-hand stuff since no such facility with SS). Provisional at present but looks like if you'd traded and reversed with the signals with no deviation since mid December last year you would be well ahead - better results on trades with each current (approx monthly) trend but both positive with only moderate drawdown - only done it with 1% of RANGE reversal so far

The rules on Kagi, per SS help, are fairly simple. It's prompted me to want to try applying some programed data-set back-testing of similar rules but I'm stuck on what software in available. I'll have a look in the various software forums, but suggestions from anyone here here would be appreciated.
 
Hey, ho, everything in the garden looks rosy for the bulls - but you know what they say when everything looks rosy :devilish:

The last three days have resulted in something of a deliberation or stalled candlestick pattern (as circled) which often presages a stall in the market rally. Maybe we'll see a bit of a retreat next week (and a test of that erstwhile resistance becoming support?), but the DOW did move up quite strongly after ftse close so maybe not.

As usual, it'll go up or go down so time will tell and we'll all obey Mully's maxim to trade what we see and not what we think won't we :confused: :LOL: :rolleyes: ;)

good trading

jon
 

Attachments

  • ftse.gif
    ftse.gif
    11 KB · Views: 276
Well, this is what I see in the weekly chart - we´ve got a buy signal as in many other charts.
Rally continues at least 2-3 days before a pullback into OEX on Friday (equities). Consolidation the week after before another run starts lasting the rest of the year. Check sectors because not all of them will take part of an eventual rally. Guess 4900 before 1st pullback and maybe 5000 end of year.
 

Attachments

  • 0ftseweek.png
    0ftseweek.png
    66.3 KB · Views: 243
Support and Resistanace

Hello Guys,

Scenario 1 - is looking at things with very simple way

Scenario 2 - explains support and resistance by complicating a little.

However, This is the way I see things, when I trade.

For clarification on the figures provided previously:

Low of 7th May 2002 - 5082.7 (Recovery Resistance)

High of 17th May 2002 5282.2 (Trend Resistance)
 

Attachments

  • S and R.gif
    S and R.gif
    4.5 KB · Views: 262
barjon said:
Hey, ho, everything in the garden looks rosy for the bulls - but you know what they say when everything looks rosy :devilish:

The last three days have resulted in something of a deliberation or stalled candlestick pattern (as circled) which often presages a stall in the market rally. Maybe we'll see a bit of a retreat next week (and a test of that erstwhile resistance becoming support?), but the DOW did move up quite strongly after ftse close so maybe not.

As usual, it'll go up or go down so time will tell and we'll all obey Mully's maxim to trade what we see and not what we think won't we :confused: :LOL: :rolleyes: ;)

good trading

jon

Considering the UK & US markets I show comparison charts for 2 & 5 years.

ftse 250 leading the way with ftse 100 bringing up the rear. This disparity between the two suggests that it is not trading conditions that holds back the 100 but elements that are intrinsic to it. eg. narrow range of sectors and weighting given to the individual companies.

What chance the dow rising to 11000 and the ftse 100 to 5000.

The US appears not to be concerned about massive debt, budget deficit, falling $ etc.
If the rise continues when does the Kagi hit the fan.

But the mully maxim holds good.

Regards

bracke
 

Attachments

  • untitled.jpg
    untitled.jpg
    61 KB · Views: 238
  • untitled.jpg2.jpg
    untitled.jpg2.jpg
    65.2 KB · Views: 209
rajpatel

Ah! thanks - isn't that a bit precise (even without the decimal points :LOL: ) for two and a half years on? May 02 was at the end of congestion period more than a year long, ranging between 5024 and 5370, so that area should cause at least a stutter or two on the way back - if we get back that far before the beary boys have their say, of course.

bracke

Interesting charts. Gives a bit if a lie to that "ftse is just a slave to the DOW" talk, but I suppose it'd look a bit different if adjusted for £:$ relationship change over the period.

Good trading

jon
 
Jon,

It is a tiny bit more precise then what we prefer. However, this is the reference from the historical data & picked by the software as a systematic approach to trading.

We may be forced to look at the Fib Resistance level before we will get to 5000 mark! I am sure there are couple of pullbacks before reaching 5000 mark.

Kind regards

Raj
 
pratbh said:
I have concluded that my timing has been entirely wrong. Whether my market analysis has also been wrong (i.e., if I have been wrong being bearish) only future will tell.

Sod's law says now that I have covered my shorts, the market should now crash.

One more point to add in my Lessons Learned Log.

I think now pratbh that you would be fairly safe to short, puting your stop loss over the last high or reaction. The market (US) was bearish before the election, but the result dragged the index higher leaving the weakness in the background. A word of warning would be that there is no excessive volume to the upside, but I think there is high option volume on the 5th and 10th with narrow spreads. You could always wait for no demand a low volume upbar on which to short.

Please find the chart attached.
(I could also be wrong, and I reserve my right to change my mind the next day if another force enters the market)
 

Attachments

  • FTSE daily.jpg
    FTSE daily.jpg
    180.7 KB · Views: 321
Here are the channels I'm working with just now - taking 1-5 day views on maybe 2-3 trades per day.

Rising bearish wedge since mid October inside another since August - quite a bearish short-term set up I'd say. Still a bit nervous about it though - volume saying contradictory things and mixed info from MACD/RSI. I actually took a small short just prior to Friday's US close (4812) - impressed by that 'hanging man' but chickened out and covered yesterday at 4770 - still, a reasonable bag.

I can't see much more upside without at least one test of the 4740'ish resistance turned support though so further intraday shorts look promising. Also, pick any bollinger period higher than the 10 days or so and we're either above or way above the upper channel - so there must surely be further correction soon.
 

Attachments

  • Image1.gif
    Image1.gif
    6.4 KB · Views: 221
  • Image2.gif
    Image2.gif
    8.2 KB · Views: 231
peterpr said:
Here are the channels I'm working with just now - taking 1-5 day views on maybe 2-3 trades per day.

Rising bearish wedge since mid October inside another since August - quite a bearish short-term set up I'd say. Still a bit nervous about it though - volume saying contradictory things and mixed info from MACD/RSI. I actually took a small short just prior to Friday's US close (4812) - impressed by that 'hanging man' but chickened out and covered yesterday at 4770 - still, a reasonable bag.

peter

Funny how we see things differently - I'm looking at a channel rather than a wedge.

The stalled candlestick pattern (see above) has delivered - and may deliver more - with yesterday's close just creeping back above my trend line. More important, maybe, is the support from the erstwhile resistance, which is also support from the base of a long white candle. Won't go bearish 'til that goes, although I did poke my stick into the bear cage.

good trading

jon
 

Attachments

  • ftsew.gif
    ftsew.gif
    9.9 KB · Views: 230
barjon said:
peter

Funny how we see things differently - I'm looking at a channel rather than a wedge.

The stalled candlestick pattern (see above) has delivered - and may deliver more - with yesterday's close just creeping back above my trend line. More important, maybe, is the support from the erstwhile resistance, which is also support from the base of a long white candle. Won't go bearish 'til that goes, although I did poke my stick into the bear cage.

good trading

jon

Hello barjon

Am I correct in thinking that peterpr shows a wedge because he is drawing his lines from further back in time than you are. If so, what determines the date from which you draw your first line from ?


I notice that on yours and VSA Traders charts the absence of an openig line on the left of the bar, can you explain please.

Regards

bracke
 
bracke,

I hope you're not going to get humerous - this is a serious business :LOL: :LOL: :LOL:

My trend line is a short term one drawn from the last reaction low and the supply line is one drawn parallel to it. On my chart (and presumably for VSA's) I'm only interested in the range and the close - hence no opening indicated.

cheers

jon
 
barjon said:
bracke,

I hope you're not going to get humerous - this is a serious business :LOL: :LOL: :LOL:

My trend line is a short term one drawn from the last reaction low and the supply line is one drawn parallel to it. On my chart (and presumably for VSA's) I'm only interested in the range and the close - hence no opening indicated.

cheers

jon

barjon

lol,lol,lol.

Now don't you start ! I'm still smarting over that and what makes it all the more galling is the very amusing post you had made previously without provoking a whisper, there's no justice.

On a more serious note - I take my work seriously - Would not the inclusion of an opening mark
and its position relative to high,low and close, together with volume, assist in assessing the strength of the bar's direction and hence the likely direction of the following bars?

Edit: Golf !!!!! This is a serious business and your off to play Golf !!!!!!

Regards

bracke
 
barjon said:
peter
Funny how we see things differently - I'm looking at a channel rather than a wedge.
jon

Jon

Funny thing I just finished perusing Cliff Droke's 'Channel Buster' offering. Your channel is a classic illustration of his proposal that an upside break of an established channel (and vice versa) are pretty reliable signals of an immanent return to the opposite channel extreme (ie 5th November). Problem is he sees the upper trendline as the more important of the two in an uptrend (and vice-versa) and therefore seeks to set that one first. Your lower corresponds nicely with the lower of the smaller of my wedge lines.

I don't think we see things too differently really - Anyway your Kagi still says up! :)
 
bracke said:
barjon

lol,lol,lol.

Now don't you start ! I'm still smarting over that and what makes it all the more galling is the very amusing post you had made previously without provoking a whisper, there's no justice.

On a more serious note - I take my work seriously - Would not the inclusion of an opening mark
and its position relative to high,low and close, together with volume, assist in assessing the strength of the bar's direction and hence the likely direction of the following bars?

Edit: Golf !!!!! This is a serious business and your off to play Golf !!!!!!

Regards

bracke

bracke

mmm, thought it might raise a chuckle from the main men - glad you found it amusing though!!

I use the candlestick charts for the full story, but have found range and close to be the most important.

Golf is a serious business too, you know :LOL:

jon
 
peterpr said:
Jon

Funny thing I just finished perusing Cliff Droke's 'Channel Buster' offering. Your channel is a classic illustration of his proposal that an upside break of an established channel (and vice versa) are pretty reliable signals of an immanent return to the opposite channel extreme (ie 5th November). Problem is he sees the upper trendline as the more important of the two in an uptrend (and vice-versa) and therefore seeks to set that one first. Your lower corresponds nicely with the lower of the smaller of my wedge lines.

I don't think we see things too differently really - Anyway your Kagi still says up! :)

peter

that's interesting - does he just need a break, or a break where the close is back in the channel?

jon
 
barjon said:
peter
that's interesting - does he just need a break, or a break where the close is back in the channel?
jon

Jon

Just a break. But, as ever there is interpretation involved. Principally, how 'established' and how steep is the channel - (trend confidence and momentum) - Steeper = more reliable but obviously less frequent. Also, among hundreds of illustrations he only provides one for an index (NASDAQ).

No suggestion that it should be used mechanically, but that it is a good primary indicator that should prompt a search for possible confirmation elsewhere. There are tradable (with hindsight) examples even on the 10 minute footsie chart for the past 3 days though he does not suggest anything other than daily HLC charts.
 
peter

that must make quite difficult drawing the upper line as the primary one.

jon
 
barjon said:
peter
that must make quite difficult drawing the upper line as the primary one.
jon

Out all day - just got back.

Agreed. but that's what the man says. Can't say I'm spending too much time on it - just keeping a weather eye out.

More interested in Kagi right now. Formula driven with tweeks, it has definate automated trading possibilities. Results much better with the trend and ignoring corrections as usual though - which leaves the perenial problem of timeframe and that the most reliable confirmation of tradeable shortish term trends being when they end.
 
Top