You are using an out of date browser. It may not display this or other websites correctly.
You should upgrade or use an alternative browser.
You should upgrade or use an alternative browser.
FTSE Beater
Experienced member
- Messages
- 1,518
- Likes
- 6
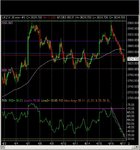
Hi Wideboy
A lovely chart 🙂
It's also good to note how fast it fell after the double top as all the sellers and shorters come into the market.
A lovely chart 🙂
It's also good to note how fast it fell after the double top as all the sellers and shorters come into the market.
FTSE Beater
Experienced member
- Messages
- 1,518
- Likes
- 6
:?: :?: :?:
Ok Now you've confused me (not difficult I know).
I just see a lovely double top at 3960, with a neckline (not sure if thats the word) at 3800 - which also shows a smaller double bottom.
Please open my eyes if I've missed something really really obvious. 🙄
Ok Now you've confused me (not difficult I know).
I just see a lovely double top at 3960, with a neckline (not sure if thats the word) at 3800 - which also shows a smaller double bottom.
Please open my eyes if I've missed something really really obvious. 🙄

FTSE Beater
Experienced member
- Messages
- 1,518
- Likes
- 6
Hi TBS
ah ok - I would short at 3960 on the basis of a double top, hence I call it a double top, when it really isn't.
Thanks for the clarification 🙂
ah ok - I would short at 3960 on the basis of a double top, hence I call it a double top, when it really isn't.
Thanks for the clarification 🙂
FTSE Beater
Experienced member
- Messages
- 1,518
- Likes
- 6
I wouldn't have gone that far Helen :cheesy: :cheesy:
FTSE Beater
Experienced member
- Messages
- 1,518
- Likes
- 6
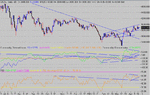
Hi Bansir
Yes it does, after all, what could be bullish in a 5 minute chart, might be extremely bearish on a yearly chart.
I called it bearish because Wideboy posted a 30 min chart, which to me spells intra-day trading.
Chartman posted an EOD chart, which appears to be bullish - in which case I would say it was short-term bearish, medium-term bullish - and get this, because of the poor state of the market, on a long term chart it's bearish. 😀
You now know why one analyst could say bearish, one says bullish and they can both be right.
At the end of the day, it comes down to knowing the time-frame your trading in
Lots of contradictory evidence around at the moment.
On the downside :-
There was a big Outside Down day on most main indices on 16.04.2003.
The VIX seems to be pointing straight down. During the whole bear market, a VIX as low as this has always marked a top.
There is a rising wedge on the ftse with a target of 3270 - close to the March lows. A 50% retracement takes ftse back down to 3620.
Elliott Wave peeps have satisfied their wave count for completion of the rally, although as ever, if the market goes up from here they will find a satisfactory alternative count with a ftse 100 top not exceeding 4225.
FTSE is banging its head on the 200 sma. which it has not exceeded in any meaningful way since Aug 2000.
on the upside :-
The VIX often spends time well below current levels in a bull market, and even this bear will not last for ever.
The rising wedge in the ftse 100 is not reflected in the individual charts of the top 12 stocks, some of which look moderately bullish.
See the excellent FTSE12 thread by TBS.
The AIQ market timing charts do not show any strong divergence between price and market breadth data. There is mild divergence with the most sensitive breadth indicator - AD Indicator, and also VP Trend, but neither are sufficiently marked for me to have sufficient faith to rely on them for a trade. Certainly nothing like the very strong divergence that happened at the March low.
There are too many trading sites forecasting a sell-off. A contrary indicator?
The rising wedge in the FTSe is not replicated in the Dow or S&P500, where it resembles a rising triangle - potentially bullish.
Oil price is falling.
So - a confused picture. A significant break with volume thru 4000 should have the bears running for cover!
Last edited:
Hi Wideboy
Good call, on my daily chart of the FTSE your double top was also signaled by divergence on the 14 CCI, in fact it was the second signal because the top before it also was plotted lower on the CCI than the previous top you refer to. Wed saw the new top create confirmed divergence and thurs saw the CCI + 100 crossover and Fri the CCI trend line break. The fact that the top on wed was the second divergence in an otherwise rising CCI sequence suggests that this move is going to last more than just 3 days IMHO. I suspect as the price rise represents a continuous move from lows of 3300 to just below 4000 we could easily see a retracement of anything from 30 - 60% of 600/700 points. Thats not a drop of 600/700 points but in the region of 180/200 - 360/420 with 50% retracement being the more popular figure so possible 300/350 points.
All IMHO
Would post chart but each time I try it does not take.
regards Kevin
If the FTSE moves lower tomorrow and closes lower than today then IMHO that confirms the DT or divergence and the 3800 level will be tested. At present the CCI and 14 RSI have been rising (last 2 days0 but if they turn tomorrow then the new tops are lower and on the underside of the rising trendline on these indicators.
Kevin
Kevin
Similar threads
- Replies
- 43
- Views
- 10K