FTSE, DAX, DOW Trading Ideas and discussions

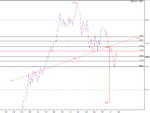
same inputs ..change the plot method
we get alot more detail..two upmoves
price broke down on friday/pink horizontal from 2116 area..this is a bull test area now
2104-2106 aqua horizontal/prev v res became support
2100 and 2096 should be horizontal supp areas to begin with..it could tank lower to 2090 area
so..minor downtrend that started on Friday..we need to see if it gains momentum..only way we can tell is on the bounce to test res and see the reaction in that area

dont think we should be calling specific levels..imho

28jlbn8.gif
 
Last edited:
dax not looking too happy
there is a big area of support that starts at 10968.bad bounce and shorts in for the kill
2mn3x2p.gif
 
into the open and Monday..thinking we need to see if those minor downtrends intensify or support comes in and they eventually get taken out
difficult to call
 
a quick look at the latest downtrend on 1 minute
long columns of "O"s/downmoves

28lwayt.gif

one small point of note...there is a fake signal/bullish about 3 pm uk time..this is the second to last column of "X"s..that soon got shoreted down..also in the previous consolidation there is a fake bullish signal that got shorted down...3 consecutive bull traps...lol
bears must have been salivating all day last Friday
 
Last edited:
bears got more control on Friday
3 bull traps/aqua..then the down columns got longer..the downtrend intensified into the US session

w1shg.gif
 
DAX
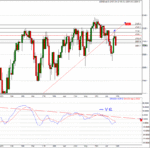
Here are PP & Fib retrace levels from daily charts view. (last weeks line chart with this weeks CS chart)

The blue line/numbers are Fib retracement.
I've added the 11250 line in blue also, as this does seem significant in previous S/R levels.

Red lines/numbers are the current H&S form in play.


The horizontal black lines are PPoints with the red-line being daily PP.


H&S still in place but I'm not a strong believer in TA. I'll give it 1/3 weighting or less in it's importance.

FA and News Data input more likely to influence direction and outcome. Perhaps I'm stating the obvious. TA is only good as far as giving us entry and exits as potential targets. So having qualified the chart;

I reckon DAX will, based on good news head North to take out PP and reach for R1 @ 11343 / R2 @ 11555 again.

R2 may coincide with the rising neck line and get rejected and then subsequently tank to 10200s in the next week or so.

If the neckline is breached on good news and results then it's likely to continue upwards to R3 @ 11824.

It's clear to see on the CS chart too DAX is hovering around the PP 11073 for the last two weeks.

I also think it's difficult to judge any moves at the moment and best to wait for new info data.
 

Attachments

  • DAX_D_150615_HS.GIF
    DAX_D_150615_HS.GIF
    20 KB · Views: 55
  • DAX_D_150620_HS_CS.GIF
    DAX_D_150620_HS_CS.GIF
    31.8 KB · Views: 67
Last edited:
SPX
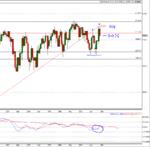
Daily charts from last week and this week attached.

PP line in red with S/Rs in black.

Showing bullish tendencies having made a HH on Thursday after Fed rate speel. Friday's CS is showing doubts. Retraced to 50% of previous days having failed to make another high.

MACD also crossed over but showing negative divergence as before to price movement.

2070 likely to be strong support. However, the HH from last week is a LL from May.

So the big question is does SPX soldier on ahead to test

the highs at R2 & R3 @ 2148

or

The lows at S2 & S3 @ 2063

Nothing conclusive as yet and price just below PP similar to Dax. Would like to see test of S1 @ 2099 and it's breach before confirming move down South.

Personally, I have a short bias on the SPX. Moreover, the red upward sloping trendline is a long-term one and has already been breached so feel we'll either move sideways at best or tank. My long term target is 1750. (n)
 

Attachments

  • SPX5_D_150615.GIF
    SPX5_D_150615.GIF
    31.9 KB · Views: 59
  • SPX5_D_150620.GIF
    SPX5_D_150620.GIF
    27 KB · Views: 60
Last edited:
Other stuff...

Gold - now the Fed has announced strong commitment to 2% inflation and low unemployment, with interest rates being data led, it's difficult to be anything else but be bullish on gold - if we take them at their word.
I have a possible test of 1230s for gold.

Rates rise may be negative on gold but they'll only raised when inflation rises. So we'll still have negative interest rates and so inflationary pressures likely to outweigh and thus bullish sentiment on gold. Much uncertainty on over valued stocks and Russian moves on Ukraine, Greece and breaking of comms with NATO likely to add geopolitical bull pressure on gold too.


WTI Oil - moving sideways, consolidating around $60. Will continue with short bias from 61-62 levels until breakout between 58-62 takes place.


DOW - pretty much same as dax and spx. See Friday's CS approx 50% of Thursdays rise. Needs to perform a HH to convince me.

Currenlty below PP @ 18035.
Suspects lows to be probed but would like to see confirmation with a good test and bounce from S1 @ 17930 region followed by PP breach to the upside.
Failure to get above PP will signal weakness and it will go down
to test S2 @ 17730
& then S3 @ 17610.

Bullish on Cable. Might give back some to test support but I see it taking out 1.60.

Becoming bullish on Euro and see it reaching up to test R3 levels @ 1.1520s but much uncertainty here as it is news dependent on Grexit. Moves are less clear. Best left alone for now unless you like volatility.


So far so good guys... Looking forward to the week with a little more sunshine and real heat.

(y)
 
Last edited:
Great analysis guys thanks.

Gonna be loads of volatility tomorrow. I think we could breakout of that 10800 -11200 for sure this week.
 
a quick look at the latest downtrend on 1 minute
long columns of "O"
one small point of note...there is a fake signal/bullish about 3 pm uk time..this is the second to last column of "X"s..that soon got shoreted down..also in the previous consolidation there is a fake bullish signal that got shorted down...3 consecutive bull traps...lol
bears must have been salivating all day last Friday

I was waiting for the Bears to show up on Friday morning haha. But a great lesson nonetheless
 
Another lesson I learnt this week. When the market tanks into those 80's areas and the bounce is weak a lot of the time it is followed by a further tank too the 000 areas. Very good to play shorts that way.
 
Great analysis guys thanks.

Gonna be loads of volatility tomorrow. I think we could breakout of that 10800 -11200 for sure this week.
that negativity on Friday has to be taken out...so any rallies...?care must be taken to make sure you dont get snared up in a bull trap
look for rally to res with no follow thru...even better if you get a retest
 
It's goin to gap down tonight
Support will come in and give the illusion this a healthy. Bull market
watch out for those bull.traps.....lol
 
It's goin to gap down tonight
Support will come in and give the illusion this a healthy. Bull market
watch out for those bull.traps.....lol


I think so too. Don't really have much faith in the rises.

Would this be a good time for me to put my real face on???


jim-carrey-the-mask-movies-810210-480x320.jpg
 
all eyes on this one
eurusd 4hour
a potential fake
the breakout /aqua on 17th/Fomc
then pullback
1.1300 /1.1280 area is support/potentail for thsi break
1.1360 is start of res
lets see if the bulls can take it higher

xc817p.gif
 
Staying away from Euro... Can go to the moon or dispatched into the dungeons.


Not for the faint heart. Must upgrade pace maker... :cheesy:
 
Top