You are using an out of date browser. It may not display this or other websites correctly.
You should upgrade or use an alternative browser.
You should upgrade or use an alternative browser.
FTSE, DAX, DOW Trading Ideas and discussions
- Thread starter Jessi_trader
- Start date
- Watchers 114
Dentalfloss
Legendary member
- Messages
- 63,404
- Likes
- 3,726
1995 marked this morning
Next time up could be 2.k excellent scalping today
Next time up could be 2.k excellent scalping today
Dentalfloss
Legendary member
- Messages
- 63,404
- Likes
- 3,726
Oil humming again
At Attillas res now
Out
At Attillas res now
Out
Dentalfloss
Legendary member
- Messages
- 63,404
- Likes
- 3,726
Held well1980 supp ??
was res
Had it marked dont think it will hold into the close
Atilla
Legendary member
- Messages
- 21,114
- Likes
- 4,304
Stella time
Nail biting time... Hoardes leaving into the yonder... Come back you cowards... 😛
Yes rallying cry has worked. Here we go.
Take II 🙂
Dentalfloss
Legendary member
- Messages
- 63,404
- Likes
- 3,726
nailedHeld well
Had it marked dont think it will hold into the close
1995 res nailed
as well
1968 area..is bull trap area
Dentalfloss
Legendary member
- Messages
- 63,404
- Likes
- 3,726
excellentPP 1974 has held.
Re-test of 1886???
Dentalfloss
Legendary member
- Messages
- 63,404
- Likes
- 3,726
a pump or a dump/pink horizontal
a couple of other areas marked
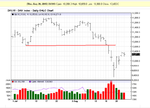
15 min spx index...not spreadbet data
plenty of horizontal supp/res can be picked off candle charts

bullish recoil in a downtrend
a couple of other areas marked
15 min spx index...not spreadbet data
plenty of horizontal supp/res can be picked off candle charts
bullish recoil in a downtrend
Last edited:
Dentalfloss
Legendary member
- Messages
- 63,404
- Likes
- 3,726
the breakout point is 1992 -2000 area...we also had 1995 marked as res on Friday...we got a magnificent dump from that area...paid for a few beers
could go either way
index seems to be in limbo
could go either way
index seems to be in limbo
Dentalfloss
Legendary member
- Messages
- 63,404
- Likes
- 3,726
Will post a new chart
Last edited:
MichaelJohnFX
Senior member
- Messages
- 2,891
- Likes
- 323

Circled yellow was a fake - bear trap. Didn't fool us though cos we had 9300 area marked - 1000 point rally since.
Bulls have had a good run but I think we're going to see a reversal this week. 10540-10620 area possible turning points. Bulls running out of room and 10620 was the breakout point - should happen on Tuesday or Wednesday as Monday is a bank holiday in the UK - Daily showing same type of exhaustion. We have Draghi speaking on Thursday so we may get a decent rally if he announces QE will be extended beyond 2016 (as analysts seem to be suggesting)
10250 was the breakout point on Friday so should provide some decent support.
Dentalfloss
Legendary member
- Messages
- 63,404
- Likes
- 3,726
Ignore stuff posted
Last edited:
here is the gap on daily candle
Are you sure there is a gap. I think there could be a days data missing from the 20th.
Attachments
Dentalfloss
Legendary member
- Messages
- 63,404
- Likes
- 3,726
Yeah on netdania
No gap
Freestockcharts there is a gap..rubbish...i wont use them again
No gap
Freestockcharts there is a gap..rubbish...i wont use them again
Last edited:
Dentalfloss
Legendary member
- Messages
- 63,404
- Likes
- 3,726
Stockcharts showing the gap filled
There is a day of data missing
thanks Cigar
There is a day of data missing
thanks Cigar
Last edited:
Dentalfloss
Legendary member
- Messages
- 63,404
- Likes
- 3,726
dax
spreadbet data

recoil in a downtrend
could go either way
trend res 10508 area
breakout point 10387
horizontal supp from 10238 down to 10150
trend supp 10120 area
then 10k major supp area/thick green
last signal was bearish
lets see what happens
spreadbet data
recoil in a downtrend
could go either way
trend res 10508 area
breakout point 10387
horizontal supp from 10238 down to 10150
trend supp 10120 area
then 10k major supp area/thick green
last signal was bearish
lets see what happens
MichaelJohnFX
Senior member
- Messages
- 2,891
- Likes
- 323
To match the analysis we did earlier I was going through some historical data i.e looking at corrections since 1998. I've observed that the market once it rebounded from a first correction low, it on average, has rebounded by 12% to then reverse back around and test the initial low it made. I've looked at corrections since 1998...
If you combine that with the price action we've been looking at over the past few days, with historical data and a declining ATR it would SUGGEST a reversal is coming around 10438 / areas we had marked earlier to test the lows again...
No hard and fast rule - positive news can change all of that. Bulls have yet to be tested properly yet since that major down move.
Similar threads
- Replies
- 4
- Views
- 2K