You are using an out of date browser. It may not display this or other websites correctly.
You should upgrade or use an alternative browser.
You should upgrade or use an alternative browser.
Hooya said:did you actually read anything that was posted on gaps last week. :cheesy:
a gap is where no trades take place,
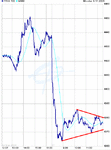
heres a chart
Attachments
Hooya
Yes I did read what was posted on gaps last week, however looking at the thumbnails that had been posted today a gap was not apparent which prompted what I thought was a reasonable question.
The chart you show makes it clear, unlike early thumbnails.
Regards
bracke
Yes I did read what was posted on gaps last week, however looking at the thumbnails that had been posted today a gap was not apparent which prompted what I thought was a reasonable question.
The chart you show makes it clear, unlike early thumbnails.
Regards
bracke
you cant rely on posters charts....What did you see when the FTSE open at 8am ? did it tick straight down.
What was the first tick on your streaming chart? charts wont always show a gap because it mearly prints a price at the close of a period hence why there was no gap on Mully's chart. Also looks at yesterday close compared to today's high. If they are the same you can besure there was a gap down somehwere. Best thing to do is go to bigcharts and look at a 2 day 1 min dot chart. You should be able to see the gaps clearly
What was the first tick on your streaming chart? charts wont always show a gap because it mearly prints a price at the close of a period hence why there was no gap on Mully's chart. Also looks at yesterday close compared to today's high. If they are the same you can besure there was a gap down somehwere. Best thing to do is go to bigcharts and look at a 2 day 1 min dot chart. You should be able to see the gaps clearly
Bracke,
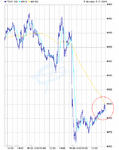
I have posted a dot chart (Bonsai's favourite way of spotting gaps) which clearly shows no trades today, until 4410 level from yesterday's close.
So technically there is a gap.
I will give you a reference on gaps:
http://www.incrediblecharts.com/technical/gaps.htm
I have posted a dot chart (Bonsai's favourite way of spotting gaps) which clearly shows no trades today, until 4410 level from yesterday's close.
So technically there is a gap.
I will give you a reference on gaps:
http://www.incrediblecharts.com/technical/gaps.htm
Attachments
"no trades today, until 4410 level from testerday's close."..not quite true as it shows the close of the first minutes trade. By chance ADVFN charts have a bug which at the moment start the 1st candle from the first tic which seems to be 430ish on my charts. BUt it doesnt really matter too much as gap relates to the previous gap so if you know there is a gap down if it gets filled you know it has to go up to 4441. The only time it might matter is if they try to defend it; then you might want to see first traded level. All imo
Last edited:
Also looks at yesterdays close compared to the high. If they are the same you can besure there was a gap down somehwere"
errrr....if the high is the same as the open (i.e yesterdays close) that shows that it didnt trade above yesterdays price thus there will be a gap down
errrr....if the high is the same as the open (i.e yesterdays close) that shows that it didnt trade above yesterdays price thus there will be a gap down
Right , cant be sure where we are but there have been some good swings today.
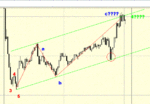
Followed this mornings charts as close as it could imo. The question is what twas the circled bit all about? Seems to have overlapped and whether you are counting an impulsice count or a corrective count its seems :?: (as Im not sure) to invalidate it. Anyway becuase im not sure Im sticking with this morning chart so this is still abc of 4 with 5 down to come but I guess the opne tomorrow will tell us where it wants to go. Have a nice evening
Followed this mornings charts as close as it could imo. The question is what twas the circled bit all about? Seems to have overlapped and whether you are counting an impulsice count or a corrective count its seems :?: (as Im not sure) to invalidate it. Anyway becuase im not sure Im sticking with this morning chart so this is still abc of 4 with 5 down to come but I guess the opne tomorrow will tell us where it wants to go. Have a nice evening
Attachments
Last edited:
Similar threads
- Replies
- 0
- Views
- 3K
- Replies
- 0
- Views
- 2K
- Replies
- 1
- Views
- 1K


