You are using an out of date browser. It may not display this or other websites correctly.
You should upgrade or use an alternative browser.
You should upgrade or use an alternative browser.
LOL its all right its on the same link as the wolfwaves...:-0)
I post more intraday charts as anyone else. .and plus being a deciple of Bonsai in some respects you should have pretty good idea. Today I posted nearly every thought I had so you knew as much as I did🙂
I post more intraday charts as anyone else. .and plus being a deciple of Bonsai in some respects you should have pretty good idea. Today I posted nearly every thought I had so you knew as much as I did🙂
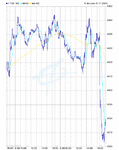
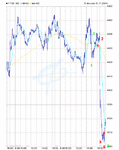
I am attempting to post a chart of the ftse100 & ftse 250
I have not posted a chart before, this is a practice.
Ureka! Success.
The point of the chart was to illustrate my early post relating to the ftse250 failing to participate
in the sharp rise and fall of the ftse100 Does it indicate further fall of the ftse 100? I will leave others more experienced than I to comment.
Regards
bracke
Last edited:
Review of last week
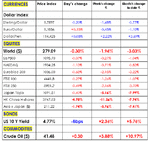
Another week of losses for global equity markets. (see table)
The two culprits, mentioned last week, continued to be harmful to equities.
US bond yields rose again by a modest 1 bps to yield 4.77%. Yields did peak at 4.85% on Thursday, but short covering on Friday saw yields fall back.
Crude Oil received most of the press coverage, rising nearly 4% to $41.48.
Equity Markets
The World Index ($) fell a further 1.94%
Once again, it was the switch out of the cyclical sectors that was the feature of the week.
In regional terms, the biggest losses were felt in Asia,
with the HK China H shares falling 11.3% on the week.
The cyclical biased Japan Topix index fell 5.2%.
Western markets were more subdued, with the key event being the successful (so far) test of the 200 day MA of the SP500 on Wednesday.
In the UK the defensive nature of the FTSE 100 (-1.3%)
continued to see it outperform its smaller FTSE250 (-2.2%).
The biggest major fallers in the UK were predominantly cyclical stocks: British Airways, Amvescap, Rolls Royce, ITV, ICI, Rexam, BAE Systems, Reuters, Anglo American.
In fact, the major damaged to the index was done on Monday is response to Wall Street's poor performance on the previous Friday.
The rest of the week saw a rather feeble attempt to rally. (I made the observation, during the week, that the FTSE100 rally had yet to recover 1/3 of the previous fall.)
Also, it is worth noting that the FTSE 100 hit 4554 four times, failing to breach the level on each occasion. So I would expect 4554 to be the short term ceiling for the market.
On a bigger picture, the question remains whether we have seen a complete ABC pattern from the 5th May that bottomed on Monday. The rally however, since then, does not look implusive.
This suggests that there may be additional downside before the move from the 5th May is complete. Bonsai's fib level of 4410 appears to be the critical level, which if breached would confirm further downside.
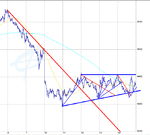
I have included a ten day, 10 minute chart with my "straight lines". It highlights the apparent barrier at 4454.
Major corporate announcements:
Monday: British Airways (F); GlaxoSmithKline (AGM)
Tuesday: BAA (F); Land Securities (F); mmO2 (F);
Wednesday: Sainsbury (F);
Thursday: National Grid(F); United Utilities(F);
Friday: LloydsTSB (AGM);
Attachments
Greetings.
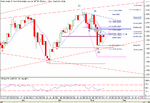
Very little change on the attached daily chart below from last week.
3 days down from the May 5th high and only 3 days up
( I don't count inside days till the count has started)
to Friday 14th May.
Then as Mully said it hit it's head on 4455 ish level 3 times. In Gann theory that can be fatel but more so when it is 3 swing highs or lows that fail...
The retracement was only 1/3rd of the move down and if May 10 low is broken this will leave a lot of spacing between the two swings indicated by the 2 blue arrows. In my mind this indicates weakness and throws May 5th swing high as a lower high
If the May 10 Low is broken a false break could reverse at previous support of around 4382 and indicated by the red arrow on March 31 low. If that less go my next target of 4327 ish is on the radar. This being equal range retracement to the Mar 8 -Mar 24 Low marked in pink. And then of course all eyes will be on the Mar 23 swing low.
Upside. Same as before, 50% Retrace = 4485 & 4498 and the Apr 30 swing low resistance is in the middle of this at 4490 before I'll be getting excited about testing the old swing highs.
Regards,
KJH
Attachments
Morning all,
Early indications are not helpful from Asia
"Taiwan's main TAIEX share index fell as much as 5.5% hit by the oil price surge and a warning by China that it would crush any independence moves by President Chen Shui-bian "firmly and thoroughly at any cost."
Seoul's benchmark Korea Composite Stock Price Index (KOSPI) fell 5%to a seven-month low.
Tokyo's Nikkei stock average was down 2.9% at its lowest since mid-February, extending the index's 12 percent fall since it hit a 33-month closing high on April 26.
Crude oil futures hit an all-time high of $41.64 a barrel in electronic trade, up 26 cents from Friday's New York close. There are worries that tight world oil supply may fail to meet peak summer driving demand for gasoline in the United States."
Idle tinkering.
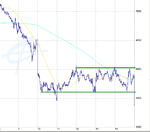
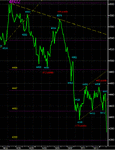
I have posted a chart of the FTSE100 from its peak of 4602.
First move =112 points
Second move =84 point rally
Third move down=179 point
Fourth move =60 point rally.
So if current move= 1st move=4343
=3rd move=4276
This will get a few going...
I have posted a chart of the FTSE100 from its peak of 4602.
First move =112 points
Second move =84 point rally
Third move down=179 point
Fourth move =60 point rally.
So if current move= 1st move=4343
=3rd move=4276
This will get a few going...
Attachments
Similar threads
- Replies
- 0
- Views
- 3K
- Replies
- 0
- Views
- 2K
- Replies
- 1
- Views
- 1K

