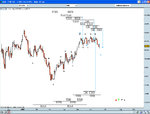
FTSE 100 Index Pivot Days

Question for HW

Just thinking about a filter rule for measuring swings for the FTP idea.

In terms of measuring valid Highs/Lows, I had mentioned that the filter rule might be a defined value of points/pips - i.e. a measured swing must move a minumum amount of points in order to qualify as a vaild measuring point.

I then thought, that if that defined value could be a function of ATR over a given amount of periods, it would then mean that valid swing values are dynamically created as a function of recent market conditions.

What do think HW - sounding reasonable?

Geo
 
Sounds reasonable to me.
Lets break it down as simply as possible and look at it this way...

Lets say you like to swing trade and decide only to look at daily charts.
Because the volatility is not that great right at that point in time that works fine.
It takes maybe 3 to 7 days for the swings to crest and ebb.
The range is 20 to 35 maybe 40 points. (SPX, OEX,FTSE 100, or what ever)
Then the market crashes like it did last year.
You now get the same swings in points happening in 1 day.
What do you do?
The market might move 100 or more points in a single swing now that last 2 to 4 days.
To get the same point values in a swing you would have to drop down to the hourly charts.
To get the same time values (same number of days in a swing) you would have to except more points right?
(I know, not many traders are going to have a problem with winning more points in a single trade.)
So the way I see it you will have to change something to keep forecasting correctly.
It has to be Time or Price. Or both.
Change Time to catch roughly the same number of points, or change Price to use the same amount of Time.

Now look at your idea to validate swings.

Does it do one or the other? Does it do both?
Keep it as simple as possible and then look at it again.
In the end it's up to you. Remember your doing the work so it will work for you right?
It doesn't have to work for anyone but you, so ultimately what do you think?

In fact, What do you think about it?

Do me a favor and tell me.
 
HW, thanks for your answer and for taking the time to break things down - it's very helpfull.

As mentioned in my pm, I'll come back with a sensible answer, once I have one... it may take some time ;) plus still packing up the house to move, what fun!

It struck me that before I go any further I should probably have a better understanding of pivots. Do you have any good reference material or links you could point me to?

Cheers, Geo
 
well you chaps lost me at 'just thinking about a filter...'

where did you pick up your insights on timing geo?
 
I originally found some info on this site - Stock Market Then I bought a book by Robert Fischer, which gives some really good examples of fib applications, including working with timing. I'm gonna have to re-read that book before starting the thread though.

I hope to add some of my own ideas to his approach as well. He just deals with the 1.618 expansion, but me being a smart a*se, I have found mulitple expansions and methods of measure that seem to work as well. Got to keep it simple though.

Dealing with fibs you will always find that multiple expansions will work as they are all related to each other by some ratio or another.
Not to push you one way or the other, I have found in my studies that the 1.618 expansion is the "master" expansion.
That's the way it seams to me any way.
Good luck with the move! They are always fun!:clap:

As far as pivots go, sorry what I have learned about them I did from LOTS of looking at charts myself, so I couldn't send you a link.
Well not yet. Once we get our Timing forum up and running I will write my observations out there.
You remind me of me about three years ago.:smart:
Always wanting to learn more.
Then you get to the point that you start mixing it all up and using things that you come up with or at least twist around. That's the fun part!!:)
 
Sounds reasonable to me.
Lets break it down as simply as possible and look at it this way...

Lets say you like to swing trade and decide only to look at daily charts.
Because the volatility is not that great right at that point in time that works fine.
It takes maybe 3 to 7 days for the swings to crest and ebb.
The range is 20 to 35 maybe 40 points. (SPX, OEX,FTSE 100, or what ever)
Then the market crashes like it did last year.
You now get the same swings in points happening in 1 day.
What do you do?
The market might move 100 or more points in a single swing now that last 2 to 4 days.
To get the same point values in a swing you would have to drop down to the hourly charts.
To get the same time values (same number of days in a swing) you would have to except more points right?
(I know, not many traders are going to have a problem with winning more points in a single trade.)
So the way I see it you will have to change something to keep forecasting correctly.
It has to be Time or Price. Or both.
Change Time to catch roughly the same number of points, or change Price to use the same amount of Time.

Now look at your idea to validate swings.

Does it do one or the other? Does it do both?
Keep it as simple as possible and then look at it again.
In the end it's up to you. Remember your doing the work so it will work for you right?
It doesn't have to work for anyone but you, so ultimately what do you think?

In fact, What do you think about it?

Do me a favor and tell me.

My original rational for attempting to create a dynamic swing filter, is that, what may be seen as a valid swing in less volatile markets, could be noise (relatively speaking) in a highly volatile market. Therefore to keep forecasting correctly, I would be adapting to the price, rather than changing the TF.

If we’re trading EUR/USD on the daily, and for arguments sake, swings crest and ebb anywhere between 3 and 7 days, would you want to consider the smaller swings that may occur during that period – the swings that were valid during a less volatile period? I would say no, but I’m happy to be corrected on that HW.

If you’re points driven, in that you would expect a projected pivot to yield a certain amount of points, relative to any TF. Could this not lead to expectations beyond just simply projecting a valid pivot? Is it possible to have expectations to the yield of a pivot? I’m not sure if that is implied in your post, or if I got my wires crossed… I shouldn’t really be typing a midnight :sleep:

I’m coming at this from the perspective of creating a filter appropriate to the TF a trader likes to trade, that avoids relative noise. If it’s possible to reverse the equation, so that you can then work out which TF you need to trade in order to deliver X amount of points, that would be great too – It might be possible, I will have to do the research.

Right, I have to leave it there for now, anything further is liable to be complete twoddle, if it isn’t already :whistling

Ok, over to you HW to break it all down - I mean that sincerely! :)

p.s. even if this all a bit too complex, and a visual inspection of the charts would suffice, I wouldn’t mind exploring the idea further, just in case there is merit.
 
At this point I don't trade the FTSE 100 index but I am thinking of doing so in the future.
As such I decided to start this thread and log my forecasts for this market much the same way I do for the SPX.

The first pivot date calculated from May 7TH and points to May 18TH, Today.
The 21St also shows to be a pivot day.

Hi
Does anyone know a good website that lists indices daily and weekly pivot points,especially for FTSE & DOW?

Thanks
 
OK, time to slap this thread back on the tracks now.
May 26th did turn the market up.
I am now looking for Friday the 29th as a pivot.
The Monday after that June 1st looks like one also.
 
My original rational for attempting to create a dynamic swing filter, is that, what may be seen as a valid swing in less volatile markets, could be noise (relatively speaking) in a highly volatile market. Therefore to keep forecasting correctly, I would be adapting to the price, rather than changing the TF.

If we’re trading EUR/USD on the daily, and for arguments sake, swings crest and ebb anywhere between 3 and 7 days, would you want to consider the smaller swings that may occur during that period – the swings that were valid during a less volatile period? I would say no, but I’m happy to be corrected on that HW.

If you’re points driven, in that you would expect a projected pivot to yield a certain amount of points, relative to any TF. Could this not lead to expectations beyond just simply projecting a valid pivot? Is it possible to have expectations to the yield of a pivot? I’m not sure if that is implied in your post, or if I got my wires crossed… I shouldn’t really be typing a midnight :sleep:

I’m coming at this from the perspective of creating a filter appropriate to the TF a trader likes to trade, that avoids relative noise. If it’s possible to reverse the equation, so that you can then work out which TF you need to trade in order to deliver X amount of points, that would be great too – It might be possible, I will have to do the research.

Right, I have to leave it there for now, anything further is liable to be complete twoddle, if it isn’t already :whistling

Ok, over to you HW to break it all down - I mean that sincerely! :)

p.s. even if this all a bit too complex, and a visual inspection of the charts would suffice, I wouldn’t mind exploring the idea further, just in case there is merit.


Ok I will try to work on this tomorrow!:cheesy:
 
OK so I don't think you will want to hear this but it looks to me like the best and fastest and simplest way to filter a pivot is with your eyes.
I tried a few different calculations and even if they were automated it would still be faster to look with your eye.
The calculation that I liked the best is:
Find the range of the last complete candle.
Then go back five candles and add the range of that candle to the first.
Then go back five more candles and do the same.
Do that to get a total of the ranges for five candles.
Divide that number by five and use that as the filter.
Don't do a fib count unless the range of the swing is greater than you filter number.
Also use the filter number as an expected move for the pivot you are forecasting with the fib count.
Not perfect but works ok.
If you automate that it wouldn't be too bad.
I still just liked to look at the chart though and decide with my eyes.

Thanks HW, your input is much appreciated. I will try your suggestion, it sounds interesting. Sadly I feel I may have inadvertently created a red herring, and that the visual check is all that's needed.

I did 5 years of backtesting on EUR/USD Daily last week, because I wanted to see how accurately the 1.618 expansion could predict a turning point. More on that later, but I also tried to define a filter rule. I tried a few different filter point sizes, then insisting that there was at least 61.8% retracement of the hi's/lo's being measured (if that makes sense), and a couple of other rules too... so far, all my filter rules seem pointless.

The results for prediction of turning points where interesting. I say turning points, because that is my understanding of a pivot for now - probably not yours though HW, but that's another discussion I guess.

I calculated 74 projections, to see how many where exact, early, or late. The results are below:

4+ days early - 8.1%
3 days early - 18.9%
2 days early - 9.5%
1 day early - 12.2%
exact - 18.9%
1 day late - 23%
2 days late - 6.8 %
3 days late - 0.0%
4+ days late - 2.7%

It's interesting, because the large proportion of projections occur before the actual event. I will need to back test again with other pairs, and for longer periods, to get more consistent percentages - but it's an ok start.
 
Yesterday was a pivot day according to the 1.618 expansion method.

Next pivot days are 22nd & 25th June - but since I am measuring from relatively small swings from a previous rangebound period, I'm not sure that much weight can be given to these dates.

Apologies that price is removed, and replaced by % - since PRT misses out the occasional daily bar, I have to do some tricky comparison thing, to fix the missing bar issue.
 

Attachments

  • ft_190609.jpg
    ft_190609.jpg
    194.5 KB · Views: 227
Thanks for the rep HW!

Still awaiting confirmation that the 25th was a pivot day.

Next anticiapted pivot days are 6th & 10th July.
 
Top