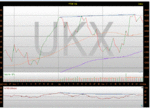
Looking at the day chart, seems we are in a double correction. Also got a 3 peak negative divergence on RSI
Jan marked a completion of a smaller flat a-b-c construction for wave A.
This being the case, EW says expect a zig-zag formation for wave B linked by any a-b-c. The linking a-b-c forming the double bottom and the zig-zag took us upto the peak of 4,524 (i'm using close prices)
So seems we are already in the start of wave C???
Target for large correction wave C.....
wave A - length of C = wave A x 1.618 = (4,524 - 4,378) x 1.618 = 146 x 1.618 = 237
C = 4,524 -231 = 4,293
This would take us the trendline linking the trough of end of June and Sep.