FTSE 100 - February 2005

peterpr and other shorters

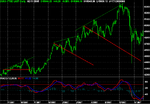
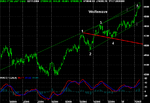
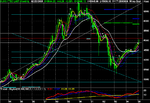
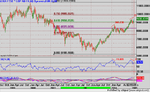
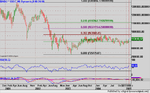
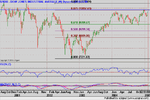
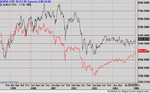
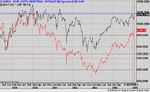
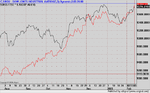
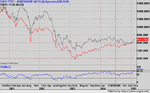
There appear to be so many indicators pointing to a pullback / retracement / reversal it is difficult to see how you can fail. So far this thread has seen standard deviation, 200 day moving average, rsi and wolfe wave all used to support a ftse fall.

That a fall will eventually occur is not argued but when would the current shorting fraternity be prepared to accept that the short that they were expecting has not come to pass ?

I ask the above question not from a bullish or bearish standpoint but merely as an interested observer.

Regards

bracke
 
Last edited:
1265 in the sp 500 is the next target and may be reached by this weeks expiration......the bull market that is looming will make the 90s look like childs play....asn the epicenter of primary wave 3 up takes hold......
 
bracke said:
peterpr and other shorters
That a fall will eventually occur is not argued but when would the current shorting fraternity be prepared to accept that the short that they were expecting has not come to pass ?
bracke

Bracke

I don't consider myself a member of 'the shorting fraternity'. Present ftse med term trend is up - absolutely no question. The question at issue is the wisdom of a particular counter-trend trade - (and possibly counter-trend trading in general) + possibly trading reversals as a method.

My own rules say 'only in exceptional circumstances'. However, I currently have a small short position from 5010 (having judged the circumstances to be exceptional). I haven't added to it - yet. Depending on how a number of indicators shape up over the coming week, I may either add to it or close it at a loss.

TS's last post is a solid cautionary one - as is the current MACD which is saying expect further immediate upside. BUT IMHO they are still trumped by the extremity of the RSI and other indicators. We shall see.
 
FTSE Wolfewaves etc.

Hi Guys,

In 97 I was caught by the 'bulls' and it hurt, but I wish I had known about Wolfewaves then. Please see attached. This month is the 7th up month so far, famous FTSE historians talk about 7s.... don't they? 5115 is about 50% retracement and 5120 is the current 3 standard devs above the 200 day MA. The current trend is up but technically there are indications for an near term correction. I'm expecting this to start ahead of option expiry on Friday ('Bradley' may be right this time). Good luck to those who have taken a hammering so far, I hope this set up works and takes the pain away.

During the big dump in 97 there were many bulls who would have appreciated the heads up as well.

Good luck
 

Attachments

  • FTSE-Wolfe-97.png
    FTSE-Wolfe-97.png
    20.1 KB · Views: 176
  • FTSE-Wolfewave.png
    FTSE-Wolfewave.png
    21.3 KB · Views: 212
  • FTSE-Monthly.png
    FTSE-Monthly.png
    25.7 KB · Views: 189
Last edited:
watercooled said:
In 97 I was caught by the 'bulls' and it hurt, but I wish I had known about Wolfewaves then.
<Snip>
During the big dump in 97 there were many bulls who would have appreciated the heads up as well.
Hi there Waterc..

Interesting charts - thanks. + sevens - brings back memories.

I was one of those 'bulls' who might have benefitted (if only..... :( ). I ran a small broker fund (circa £5 million including some of my own) - Just didn't see it coming - not even a hint - no electronic trading or serious TA - brokers phones permanently off the hook - dropped 35% before I could get the lot into cash :eek: . It's hard enough taking a serious hit on your own account, but a life-changing event when a professional reputation is on the line as well. Cured me of perma-bull tendencies once and for all I can tell you.

Never been involved in managing other peoples' money since - and never will.

OOPS - So hung up on 7, misread 9 for 8 :eek: . Experience just as vivid even after 17+ years though
 
Last edited:
Interesting to plot Footsie in US Dollars.

On that basis it has already retraced more than 62% of the 2000 decline. Also both MACD and RSI are more indicative of an immanent retrace. Looks like negative divergence in the making (as suggested by TS) on the RSI for example.
 

Attachments

  • ftse-USD.png
    ftse-USD.png
    142.4 KB · Views: 186
peter

With a 17 year old scar like that no wonder you're always watchful for the bear. Must have been a shattering experience.

Aside from your indicators and watercooled's wolfs (not a good name given the cry wolf proverb :LOL: ) there doesn't seem a lot to halt this latest surge. Course we are just about up against fib50% retracement of the whole bear move and into that 2002 congestion zone so..................

I'm not sure what the equivalent of trying to catch falling knives is at the other end but it's maybe safer to wait for a down move to start rather than anticipate it. In the meantime I'm still favouring longs (but I would like a little correction on ftse to give me another entry since I'm on the sidelines at the moment:)

good trading all

jon
 

Attachments

  • ftse.gif
    ftse.gif
    9.5 KB · Views: 198
  • ftsem.gif
    ftsem.gif
    9.9 KB · Views: 172
barjon said:
peter
With a 17 year old scar like that no wonder you're always watchful for the bear. Must have been a shattering experience.
jon
It was. Especially because I knew most of the investors personally. All clients of a provincial Life Brokerage unlike the large institutional fund managers. In many ways the markets are beginning to take on a similar feel, although back then we'd had close to a 40% rise in 10 months rather than the 16% or so to date in 7, so mustn't get carried away.

Agree with everything else you say. Not sure where I first saw the 'catching falling knives' thing, but it's a good analogy. My present trade is simply a tentative attempt to catch an overdue correction in a trend that I agree should have further upside. Will try to avoid severed fingers.
 
For those who think the US indices (particularly the DOWas its closest US proxy) are performing much better than Footsie, having retraced .875 of the decline from 2001, here's the DOW corrected for the dollar index which has the peak of the retrace at about .382 back in March last year with a choppy decline ever since. Footsie is currently at @50%, but in dollar terms @70%

With the accelerating interdependence of markets and in particular the dramatic advance of the FOREX markets, I suspect there's a tradeable system lurking in considerations like this - possibly worth a dedicated thread?
 

Attachments

  • Dow-USDindex.png
    Dow-USDindex.png
    130.7 KB · Views: 182
  • Dowretrace.png
    Dowretrace.png
    108 KB · Views: 195
peterpr said:
For those who think the US indices (particularly the DOWas its closest US proxy) are performing much better than Footsie, having retraced .875 of the decline from 2001, here's the DOW corrected for the dollar index which has the peak of the retrace at about .382 back in March last year with a choppy decline ever since. Footsie is currently at @50%, but in dollar terms @70%

With the accelerating interdependence of markets and in particular the dramatic advance of the FOREX markets, I suspect there's a tradeable system lurking in considerations like this - possibly worth a dedicated thread?

I seem to recall we did discuss this on one of the ftse threads some time ago. We came to the conclusion that the change in $/£ was responsible for the ftse appearing to break away from its close relationship with the dow (I think). At that time someone (maybe Bonsai - wonder what's become of him?) posted a ftse and dow relative chart with both based on $ or £. Can your box of tricks do the same?

jon
 
barjon said:
At that time someone (maybe Bonsai - wonder what's become of him?) posted a ftse and dow relative chart with both based on $ or £. Can your box of tricks do the same?
jon
Here is the Footsie (Red) and DOW (Black) in both US Dollars and GB Pounds. Footsie's underperformed the DOW by about 15% since 2000. So I lifted Footsie by 15% - Almost in lock-step since October last year.
 

Attachments

  • DOWFTSEGBP.png
    DOWFTSEGBP.png
    129.1 KB · Views: 171
  • Dowftseusd.png
    Dowftseusd.png
    124.8 KB · Views: 184
  • DOWFTSEUSD2.png
    DOWFTSEUSD2.png
    73 KB · Views: 195
mmm, interesting - maybe we should pay more attention to the forex threads :LOL:
 
mornin' all

not much volume or movement to speak of as yet. Everyone waiting with bated breath?

jon
 
Waiting for a lead from the US I guess. Reluctant to give up anything but so overbought that solid US lead needed to continue up without a correction. Main US indices nothing like as overbought as UK, so potential for further immediate upside there.

No clear concensus among the US analysts I follow - bias is a down week but .... we'll see soon enough.

BTW attached chart of DOW & FTSE in Euros with the FTSE bosted 15% - correlation even more uncanny
 

Attachments

  • FTSE-DOWEUR.png
    FTSE-DOWEUR.png
    93.8 KB · Views: 187
watercooled said:
.... I'm expecting this to start ahead of option expiry on Friday ('Bradley' may be right this time).

Hi Waterc..

Interested in your reference to Bradley and yes, it does look an interesting setup right now. Do you follow it much? - If so which software? - I've had a chunter around Fib trader and Wave59 both of which include it as standard but I'm wary of anything that hasn't got a lively European/UK user base.

Any observations welcome.
 
Bradley etc

peterpr said:
Hi Waterc..

Interested in your reference to Bradley and yes, it does look an interesting setup right now. Do you follow it much? - If so which software? - I've had a chunter around Fib trader and Wave59 both of which include it as standard but I'm wary of anything that hasn't got a lively European/UK user base.

Any observations welcome.

Hi Peterpr,

I really like the the 'Bradley' concept (who wouldn't, turn when it tells you etc, shame it doesn't quite work like that ), but as a 'trade what you see' position trader I have little faith in it.(Haven't used any software though, use Tradestation) However, when it matches the set ups I can see on my screen, I do focus a little sharper, as it can prove to be very effective when it does work. And as the 'Boards' have been shouting, "16 Feb 05" I will be keeping a close eye on Wednesday.

During '87 I was trading FTSE stocks, stock options and index options (long options only) so I was spared real pain but the lessons we learned then cannot be bought. I never short 'out of the money' index puts anymore after '97, for instance.

Had a 'Wimp day' on the FTSE today, good sign... just need the options hedges to be unwound coupled with a little more selling on the banks and oils and we should be off. Just waiting for the Nasdaq to lead the way down again....... no signs yet. If not , I'll just close my shorts out and blame the school holidays.. again!

Regards
 
barjon said:
I seem to recall we did discuss this on one of the ftse threads some time ago. We came to the conclusion that the change in $/£ was responsible for the ftse appearing to break away from its close relationship with the dow (I think). At that time someone (maybe Bonsai - wonder what's become of him?) posted a ftse and dow relative chart with both based on $ or £. Can your box of tricks do the same?

jon
the dow is only 30 stocks......hardly a measure of the market......in fact the broadest measure of market activity the weekly AD line is melting up after bottoming in march 2000......amazing isnt it.....march 2000......yes ...in fact it topped in oct 97 and declined in three distinct waves to its low in 2000.....one of the reasons the value line index is well into historic all time high territory. with the russell....the bull market of the 90.s will look like childs play in the coming melt up.....
 
Folks,

Any views on which direction FTSE100 is going? I have started to short at these levels, but already having doubts about my action.
 
allways look for reasons to be long....its easy to be bearish...every body does. it....once the footsee penentrates its 50% retrace at 5114.05 the next target at 5547.48 is next.......the 7000 high is going to be exceeded..........this is the london 100 index im talking about.....the mibtel is in the same positions as the footsee....paris is lagging but has not yet reached its 38.2 retrace...when it goes all of europes markets will explode.....asian markets in the same boat.....a world wide inflationary economic boom of unparralleled proportions is under way.......best 2 u.....www.wolanchuk.com
 
dacheif said:
allways look for reasons to be long....its easy to be bearish...every body does. it....once the footsee penentrates its 50% retrace at 5114.05 the next target at 5547.48 is next.......the 7000 high is going to be exceeded..........this is the london 100 index im talking about.....the mibtel is in the same positions as the footsee....paris is lagging but has not yet reached its 38.2 retrace...when it goes all of europes markets will explode.....asian markets in the same boat.....a world wide inflationary economic boom of unparralleled proportions is under way.......best 2 u.....www.wolanchuk.com

America loves its cheerleaders doesn't it? Great for football games I guess but hardly a shrewd substitute for rational analysis when it comes to markets and the global economy. Irrational exuberance I'd call it - you know, the stuff bubbles are inflated with - good for selling stocks, property and host of other wildly inflated asset classes - and of course snake oil.

7000 eh? - that's a 40% advance on present levels. Care to put a time-frame on it and provide some reasoning?
 
Top