Hi NVP,
As a n00bian I found your introduction utube video super useful for understanding this indicator/subject, I hope it's still applicable.
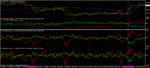
It says 'buy' those above the line because the currency is STRONG, and 'sell' those below the line because the currency is WEAK. Can you give some more information/clarity on the following scenarios pretty please.
ALL CORRECT ABOVE
👍
1) What if the 'wanting to buy currency' above the line is moving down towards the 0 line, and the 'wanting to sell currency' below the line is moving up to the 0 line?
ONLY TRADE
DIVERGING CURRENCIES FROM THE ZERO (up and down)......CONVERGING CURRENCIES ARE WEAKENING IN STRENGTH so dont enter on that signal....
😎
2) What if the 'wanting to buy currency' above the line is moving up further from the 0 line, and the 'wanting to sell currency' below the line is moving down further from the 0 line? (obviously the best trade i would say/guess).
100% PRIMO TRADE SIGNAL ....both DIVERGING CURRENCIES
👍
3) What if the 'wanting to buy currency' above the line is moving down towards the 0 line, and the 'wanting to sell' currency below the line is moving down further from the 0 line?
TRY TO ALWAYS TRADE 2 DIVERGING CURRENCIES ....this is 50% ok
😏
4) what if the 'wanting to buy' currency above the line is moving up further from the 0 line, and the 'wanting to sell' currency below the line is up towards the 0 line?
AS ABOVE .....only 50% ok
😏
(same answer as 3 i would say as Relative Strength remains still).
I have a little idea on these scenarios, but would love to hear how you would word and explain it. Thanks so much for your time on this thread, and if i am jumping te gun, obviously continue at your pace of teaching this subject/indicator.
POST THEM HERE AND WE CAN PLAY WITH THEM :smart:
hyb