Forex strengthmeters - the basics

thanks Jedster sounds reasonable,

would i expect to see the same "missing data" when scrolling other oscillator indicators?
 
For me in Hotforex MT4 it works but has spikes on some zooms or time scrolls left or right.

But in FXCM and GKFX MT4 it just appears blank no matter what i do - what could this be? All 3 MT4 platforms are the same build?
 
thanks Jedster sounds reasonable,

would i expect to see the same "missing data" when scrolling other oscillator indicators?

It is going to be entirely dependent on what the indicator is doing.

If you use another indicator that only uses data from just the pair chart it is on (which is the majority of indicators), then probably not.

Alternatively, if you use an indicator that uses data from other currency pairs, irrespective of the chart it is on, then possibly yes, you might see similar issue, but again, it is going to depend on what that indicator is doing.

J
 
For me in Hotforex MT4 it works but has spikes on some zooms or time scrolls left or right.

But in FXCM and GKFX MT4 it just appears blank no matter what i do - what could this be? All 3 MT4 platforms are the same build?

All these issues about the indicator not displaying properly are related to data. The data for one (or more) of the major currency pairs is either missing, or there are holes, or the data is wrong.

Note that when I say data, that includes differences with the symbol name. GKFX for example add the suffix "SB" to their spreadbetting symbols, so you need to make sure you have added the suffix. I think there is a property called "SymbolSuffix" in the indicator where you would need to specify this. But other than that, you need to ensure the data, for all major symbols, and not just the chart that the indicator is loaded on, is correct.

As an example, I have attached a screen shot of a USDJPY chart. There is a big hole in this chart, but it is actually quite difficult to detect if you just scroll through the chart quickly. It just looks like a Sunday opening gap, however that is not what it is. This hole in the data will affect how the indicator is displayed.

J
 

Attachments

  • correlator.png
    correlator.png
    23.8 KB · Views: 288
For me in Hotforex MT4 it works but has spikes on some zooms or time scrolls left or right.

But in FXCM and GKFX MT4 it just appears blank no matter what i do - what could this be? All 3 MT4 platforms are the same build?

Maybe you didn't update your MT4 to the latest version. Just check and update it.
 
thanks J............I'm around today so will try to catch up by phone later

I will also post some more lessons here later today

N
 
hey all

jees i'm sorry ...I will try to get more on this thread over the weekend

N
 
Another virus on my laptop this weekend

Grrrrr

Sorry

N
 
Hi Everyone

A poor excuse - but Workload is keeping me from regular updates here presently and expanding the Bsasic training

I will continue this thread as and when time allows

N
 
Last edited:
ok i will try to keep this moving later ...............before I step up to showing the currency Strengthmeter in the Indexed forms I use it I was going to cover the following by still using the USD Strengthmeter I have been using with just the E/U on the page

Divergence trading signals
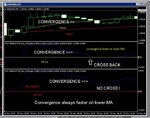
Convergence Trading signals
Basic entry criteria
Basic Exit Criteria

let me know if anything else needed before me move on.......Remember most of this is still generic and can be used on any Instrument ........I am showing the basics of MA analysis and trading

N

OK - I will try again to keep this moving .........

N
 
just to repeat them

heres the E/U with a USD strengthmeter underneath (only Euro shown)

20ma setting ................See how the yellow 20ma line has been stretched and made the ZERO line in the indicator ?

the ZERO line tells you if the current instrument value is above or below the MA setting

above the Zero represents strength and bullish
below the Zero represents weakness and bearish

N

DIVERGENCE = the movement of the price line AWAY from the ZERO.....

UPWARDS DIVERGENCE = BUY IT
DOWNWARDS DIVERGENCE = SELL IT

understood ?...good :)
N
 

Attachments

  • EU divergence.JPG
    EU divergence.JPG
    100.6 KB · Views: 378
not sure if the system is giving you fast enough signals ?

reduce the MA setting (ie instead of the default 20ma drop down to even a 5ma and inbetween)

but beware Mr Whipsaw :smart:
N
 
Last edited:
worried about whipsaws on lower MA settings ?

try adding new price entry bands that take over from the Zero...it will keep you out of some whip......but remember you lose some early action on a big price move .....

so instead of entering and exiting on th eZero line use the 2 new lines shown

use historic data / trial and error to reset your new line friends on each timeframe.......

and remember if you change the MA setting you will also have to reset the bands..... as this changes all calculations on the indicator

understood ?.....good :)

N
 

Attachments

  • price bands.JPG
    price bands.JPG
    103.3 KB · Views: 343
once you have got your bands in place and a decent MA setting you like

Basic entry criteria = when a line closes ABOVE the Top Band (buy signal ) or closes Below the Bottom Band (Sell signal)

Basic Exit criteria = when a line closes back ABOVE the bottom Band (closes a Sell signal) or closes back Below the Top Band (closes a buy signal)

what - you see times when the whip loses you money or the run is not long enough above / below the Band ? :eek:

you mean.......Trading isnt always 100% winners ? :eek:

go figure .....!!! :)

N
 

Attachments

  • entry and exits using bands.JPG
    entry and exits using bands.JPG
    114.4 KB · Views: 353
Last edited:
thats about it using the simple E/U examples here .....I'll start talking my currency strengthmeter soon .....

go back to the start and take a look again - everyhing to date on this Thread can be used generically on any Market or instrument ...it is not restricted to trading currencies

I havnt even started yet on that :)
N
 
once you have got your bands in place and a decent MA setting you like

Basic entry criteria = when a line closes ABOVE the Top Band (buy signal ) or closes Below the Bottom Band (Sell signal)

Basic Exit criteria = when a line closes back ABOVE the bottom Band (closes a Sell signal) or closes back Below the Top Band (closes a buy signal)

what - you see times when the whip loses you money or the run is not long enough above / below the Band

you mean.......Trading isnt always 100% winners ?

go figure .....!!! :)

N

you could also add bands to the MACD stuff i discussed earlier in the thread

it wont bite you if you do :cool:

N
 
and finally CONVERGENCE

CONVERGENCE is the return of the line back towards the Zero on the indicator....from above the Zero going back down ....or from below the Zero rising back up

it signifies that momentum is falling..........the lower the MA the faster this will happen .........so when the momentum slows on an instrument ......the 20ma will drag the line back to the Zero faster than say the 50ma .......

its not magic............just the way things work ........

theres nothing wrong with convergence ........its a great way of calling time on a trade as momentum folds on your move.........get outta there !!

and if the momentum fires up again go back in .......ok ?

ok ! :)

N
 

Attachments

  • convergence.jpg
    convergence.jpg
    86.6 KB · Views: 430
Last edited:
ok thats a quick burst of effort to close out the simple basics of trading on strengthmeters ...........

as I have discussed already - I have used an E/Usd strengthmeter (just showing the blue euro) against the E/U pairchart so you can see EXACTLY what is happening

once I start rolling on the FXCorrelator you cannot see things on the pairchart I use as its just there to provide the feeds

later
N
 
Top