Hi everyone,
The latest Commitments of Traders review is out (here).
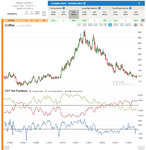
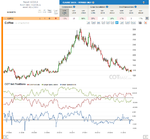
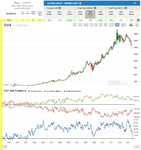
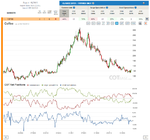
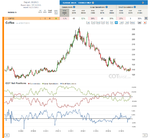
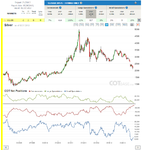
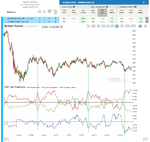
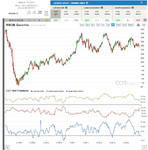
Coffee
COT Change (52W) / C-23%, LS-20% /
COT Index (3 year lb.) / C-98%, LS-5%, SS-36% /
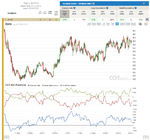
I think one of the nicest markets these days is Coffee. We’ve got a significantly large extreme and this week an also big change in traders’ positions. Both of these signals are bullish signals.
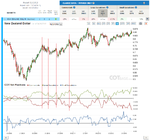
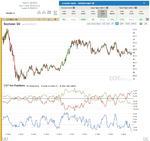
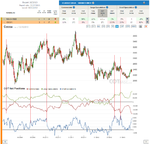
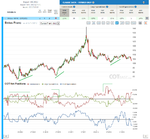
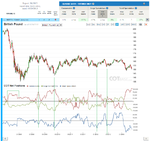
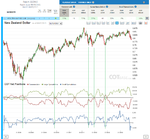
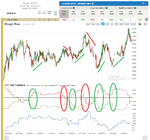
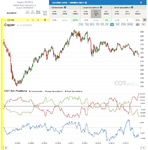
New Zealand Dollar (NZD/USD)
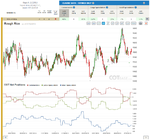
COT Extreme / C & LS-All Time COT extreme /
We’ve got a very nice, All Time cot extreme signal in NZD and if we look at the historical charts, we can see that these extremes were always very accurate signals. (we have a bearish one now)
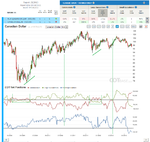
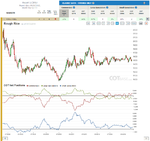
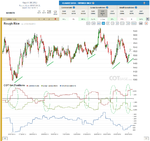
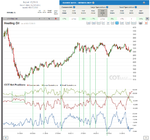
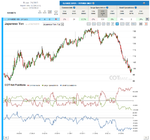
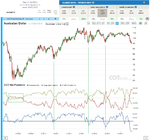
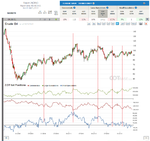
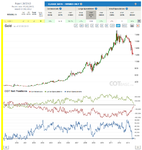
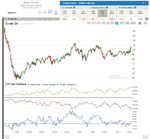
Canadian Dollar (CAD/USD)
COT Extreme / C-327 report, LS-323 report COT extreme /
It’s always nice to see opposite signals in currencies, cause it can give us the opportunity to trade the pair. We’ve got a very large cot extreme in Canadian dollar that suggests, prices will stop their decline, and we’ll see higher prices soon.
I wish all of you good luck to this week’s trading,
All the best,
Dunstan
the original COT report --> here
COT charts --> here
The latest Commitments of Traders review is out (here).
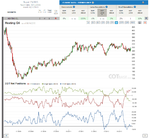
Coffee
COT Change (52W) / C-23%, LS-20% /
COT Index (3 year lb.) / C-98%, LS-5%, SS-36% /
I think one of the nicest markets these days is Coffee. We’ve got a significantly large extreme and this week an also big change in traders’ positions. Both of these signals are bullish signals.
New Zealand Dollar (NZD/USD)
COT Extreme / C & LS-All Time COT extreme /
We’ve got a very nice, All Time cot extreme signal in NZD and if we look at the historical charts, we can see that these extremes were always very accurate signals. (we have a bearish one now)
Canadian Dollar (CAD/USD)
COT Extreme / C-327 report, LS-323 report COT extreme /
It’s always nice to see opposite signals in currencies, cause it can give us the opportunity to trade the pair. We’ve got a very large cot extreme in Canadian dollar that suggests, prices will stop their decline, and we’ll see higher prices soon.
I wish all of you good luck to this week’s trading,
All the best,
Dunstan
the original COT report --> here
COT charts --> here