Hi everyone,
The latest Commitments of Traders review is out (here).
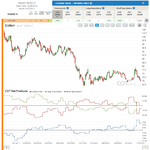
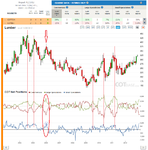
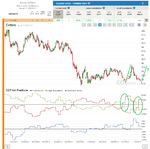
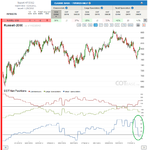
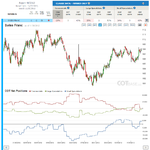
Cotton
COT Change (52W) / C-24%, LS-17%, SS-18% /
It looks like cotton is still on the “radar”. It is important to see the wider picture, the extreme in the market which still indicating a bullish picture. The risk/reward of such a trade could also be favorable now if you look at the chart.
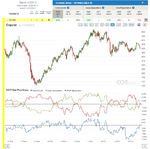
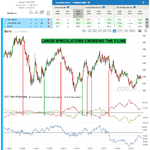
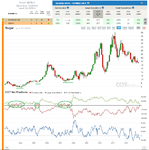
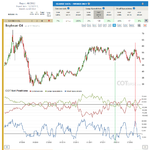
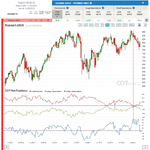
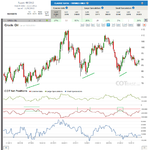
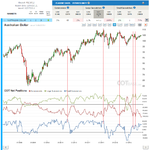
Copper
COT Change (52W) / C-20%, LS-31%, SS-12% /
Large speculators have turned net short. Although the change signal is a bullish one, looking at all metal markets, the cot extreme that we could witness everywhere for the past couple of weeks suggest that the decline will continue.
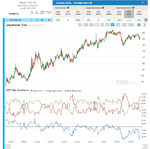
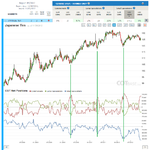
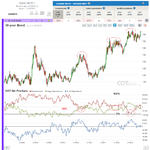
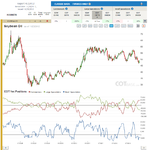
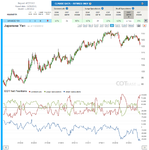
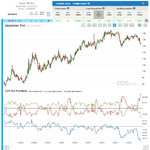
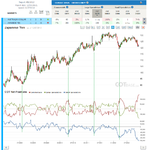
Japanese Yen
COT Extreme /SS-All Time/
COT Index (3 year lb.) / C-84%, LS-24%, SS-0% /
last week’s comment: Whenever we have witnessed such changes in C-LS-SS positions in the past, they usually ended in a COT extreme that resulted in a bottom in prices. We still got some space left for this trend to continue and really get a COT extreme picture, so prices could continue their decline.
We are getting close /or in case if Small Speculators, we are already there/ the extreme that – as the past examples show- should signal a relative bottom in prices.
I wish all of you good luck to this week’s trading,
All the best,
Dunstan
the original COT report --> here
COT charts --> here
The latest Commitments of Traders review is out (here).
Cotton
COT Change (52W) / C-24%, LS-17%, SS-18% /
It looks like cotton is still on the “radar”. It is important to see the wider picture, the extreme in the market which still indicating a bullish picture. The risk/reward of such a trade could also be favorable now if you look at the chart.
Copper
COT Change (52W) / C-20%, LS-31%, SS-12% /
Large speculators have turned net short. Although the change signal is a bullish one, looking at all metal markets, the cot extreme that we could witness everywhere for the past couple of weeks suggest that the decline will continue.
Japanese Yen
COT Extreme /SS-All Time/
COT Index (3 year lb.) / C-84%, LS-24%, SS-0% /
last week’s comment: Whenever we have witnessed such changes in C-LS-SS positions in the past, they usually ended in a COT extreme that resulted in a bottom in prices. We still got some space left for this trend to continue and really get a COT extreme picture, so prices could continue their decline.
We are getting close /or in case if Small Speculators, we are already there/ the extreme that – as the past examples show- should signal a relative bottom in prices.
I wish all of you good luck to this week’s trading,
All the best,
Dunstan
the original COT report --> here
COT charts --> here