Hi everyone,
The latest Commitments of Traders review is out (here)
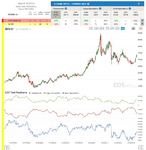
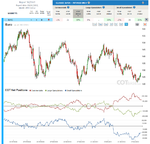
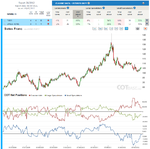
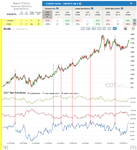
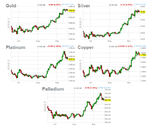
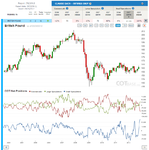
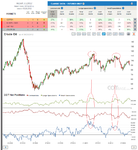
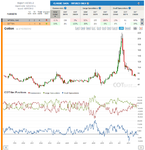
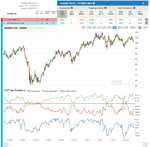
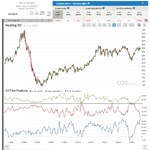
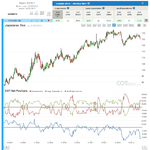
Silver
The size of change was again larger than average. Market participants have started to move towards their bearish extreme levels, although we are definitely further away from these levels than for example in Platinum.
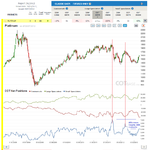
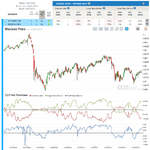
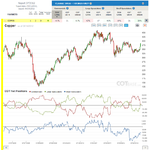
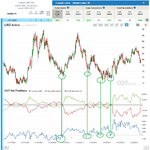
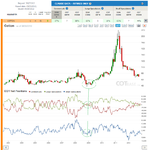
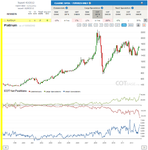
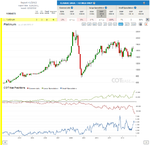
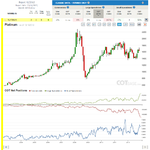
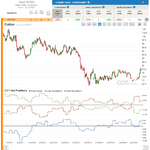
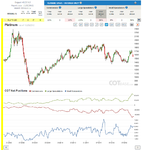
Platinum
Large Speculators have reached an all-time net long position, which is an extreme COT signal, but as said in the review, the picture is not the same as in the previous two cases. The volume and open interest total score being 16 is a bullish signal and the fact that other metal markets are not at their COT extreme levels yet, suggests that the rally could continue, but we should be at the lookout for a possible down-turn.
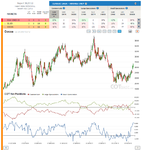
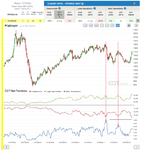
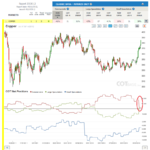
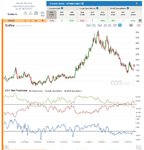
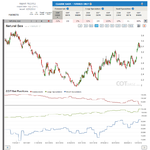
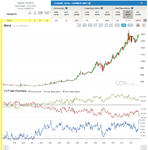
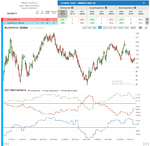
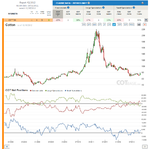
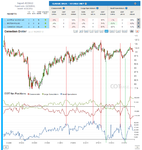
Cocoa
The reason why it has been mentioned is the size of change that happened in Commercials’ positions, but what is interesting here is that Small Speculators are near extreme levels (COT Index 97%). The picture is becoming bearish.
I wish all of you good luck to this week’s trading,
All the best,
Dunstan
the original COT report --> here
COT charts --> here
The latest Commitments of Traders review is out (here)
Silver
The size of change was again larger than average. Market participants have started to move towards their bearish extreme levels, although we are definitely further away from these levels than for example in Platinum.
Platinum
Large Speculators have reached an all-time net long position, which is an extreme COT signal, but as said in the review, the picture is not the same as in the previous two cases. The volume and open interest total score being 16 is a bullish signal and the fact that other metal markets are not at their COT extreme levels yet, suggests that the rally could continue, but we should be at the lookout for a possible down-turn.
Cocoa
The reason why it has been mentioned is the size of change that happened in Commercials’ positions, but what is interesting here is that Small Speculators are near extreme levels (COT Index 97%). The picture is becoming bearish.
I wish all of you good luck to this week’s trading,
All the best,
Dunstan
the original COT report --> here
COT charts --> here