Hi everyone,
The latest Commitments of Traders review is out (here).
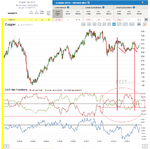
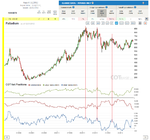
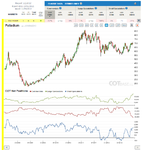
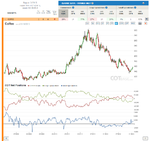
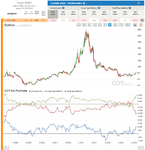
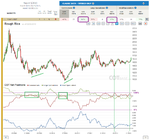
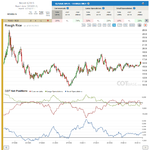
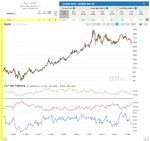
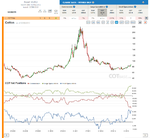
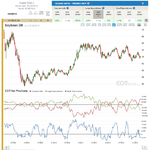
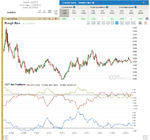
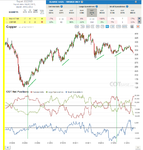
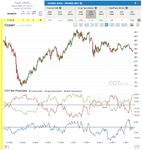
Copper
COT Change (52W) / C-21%, SS-32% /
If we look at the 5 year chart of Copper, we can see that we don’t really have a clearly large COT extreme in the market. It is mainly the change size that could affect prices. As the review correctly suggests, if we look at a shorter time period, then we arrive at a relative extreme in the market. I have indicated the two last cases, when we had such a large extreme. I’m not saying that it is Copper that is the most exciting trade this week, but for anyone trading it regularly, it is wise to look at it this way.
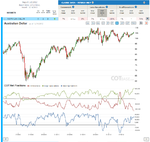
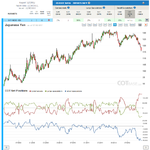
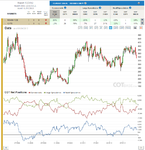
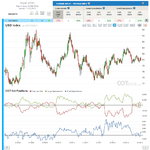
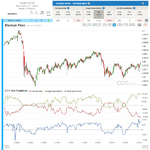
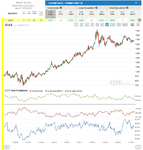
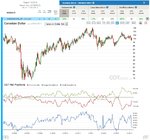
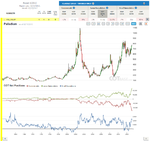
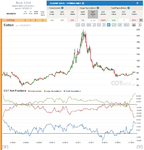
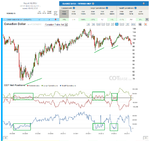
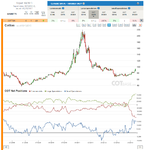
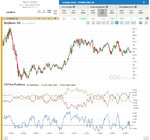
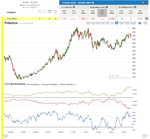
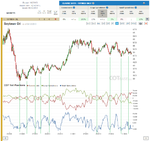
Australian Dollar
COT Extreme / C- All Time, LS-All Time /
The extreme we saw last week in AUD has widened more, now Commercials are at their All Time levels too. It is a definite bearish picture that we have.
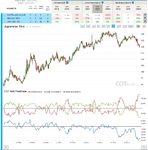
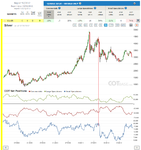
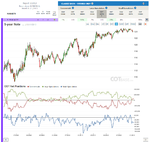
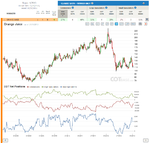
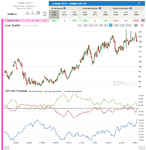
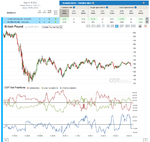
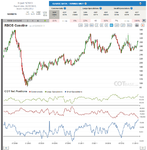
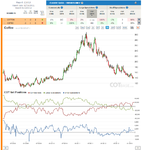
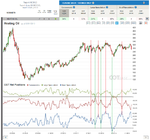
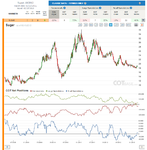
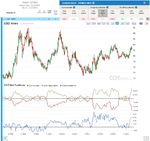
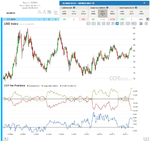
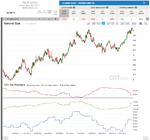
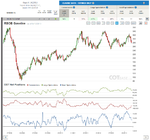
Japanese Yen
COT Extreme / close to All Time level everywhere /
The extreme has stopped widening in this market, which could easily mean that we have reached the extreme --> we should be witnessing higher prices soon.
I wish all of you good luck to this week’s trading,
All the best,
Dunstan
the original COT report --> here
COT charts --> here
The latest Commitments of Traders review is out (here).
Copper
COT Change (52W) / C-21%, SS-32% /
If we look at the 5 year chart of Copper, we can see that we don’t really have a clearly large COT extreme in the market. It is mainly the change size that could affect prices. As the review correctly suggests, if we look at a shorter time period, then we arrive at a relative extreme in the market. I have indicated the two last cases, when we had such a large extreme. I’m not saying that it is Copper that is the most exciting trade this week, but for anyone trading it regularly, it is wise to look at it this way.
Australian Dollar
COT Extreme / C- All Time, LS-All Time /
The extreme we saw last week in AUD has widened more, now Commercials are at their All Time levels too. It is a definite bearish picture that we have.
Japanese Yen
COT Extreme / close to All Time level everywhere /
The extreme has stopped widening in this market, which could easily mean that we have reached the extreme --> we should be witnessing higher prices soon.
I wish all of you good luck to this week’s trading,
All the best,
Dunstan
the original COT report --> here
COT charts --> here