Hi everyone,
The latest Commitments of Traders review is out.
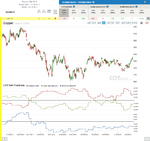
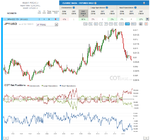
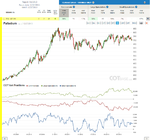
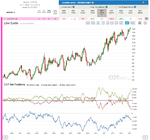
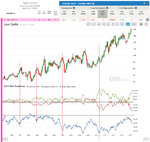
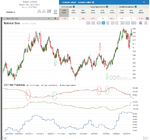
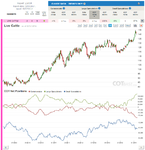
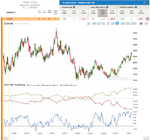
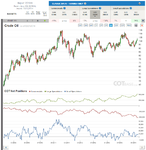
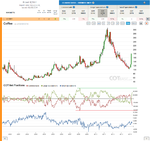
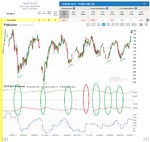
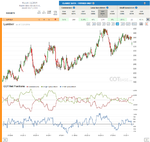
Copper
COT Change (52W) / C – 22%, LS - 28% /
We’ve got our two major cot analysis tools pointing the opposite way this week: the change in Trader’s positions was large, suggesting prices should decline, but the last great cot extreme in the market that started the recent rally is still in place. Of course “worry we should not” (Yoda🙂), cause their timing is different… even if we experience a bit of a decline now (which judging by the effectiveness of cot change signals in copper, I expect), the wider picture seems to support the continuation of the rally.
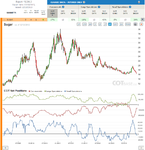
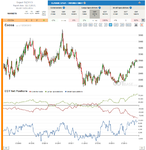
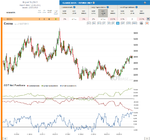
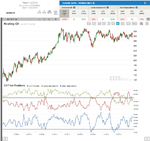
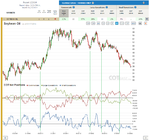
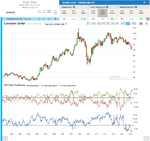
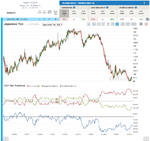
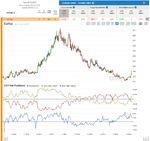
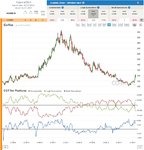
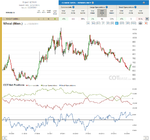
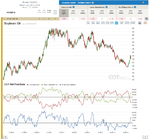
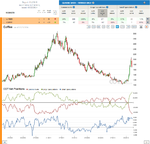
Sugar
COT Change (52W) / C – 22%, LS - 28% /
COT Index (3yr lookback) / C – 63%, LS - 43%, SS – 29% /
It’s wonderful to see, how the recent bearish cot extreme ended signaled the recent top and how Traders have moved away from their extremes as prices decline. The change suggests prices could have a “bit of a break” in the decline, but since we are not that close to a bullish cot extreme (would be the case if C reached >20.000 contracts net long / LS reached <10.000 contracts net short), I expected prices to continue the decline.
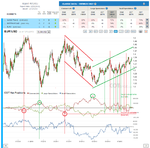
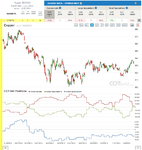
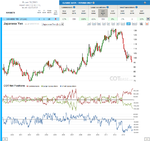
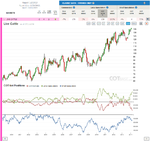
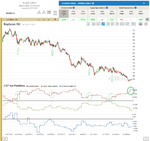
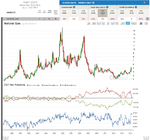
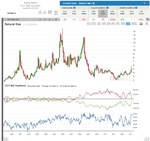
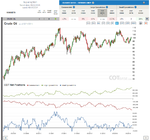
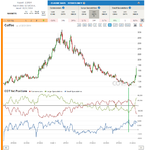
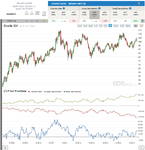
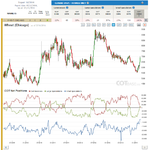
Cocoa
COT Extreme / LS – All Time COT extreme /
The very large stress that has built up in Cocoa market indicates that the fuel in this recent rally is running out…
I wish all of you good luck to this week’s trading,
All the best,
Dunstan
the original COT report
COT charts
Commitments of Traders basics
The latest Commitments of Traders review is out.
Copper
COT Change (52W) / C – 22%, LS - 28% /
We’ve got our two major cot analysis tools pointing the opposite way this week: the change in Trader’s positions was large, suggesting prices should decline, but the last great cot extreme in the market that started the recent rally is still in place. Of course “worry we should not” (Yoda🙂), cause their timing is different… even if we experience a bit of a decline now (which judging by the effectiveness of cot change signals in copper, I expect), the wider picture seems to support the continuation of the rally.
Sugar
COT Change (52W) / C – 22%, LS - 28% /
COT Index (3yr lookback) / C – 63%, LS - 43%, SS – 29% /
It’s wonderful to see, how the recent bearish cot extreme ended signaled the recent top and how Traders have moved away from their extremes as prices decline. The change suggests prices could have a “bit of a break” in the decline, but since we are not that close to a bullish cot extreme (would be the case if C reached >20.000 contracts net long / LS reached <10.000 contracts net short), I expected prices to continue the decline.
Cocoa
COT Extreme / LS – All Time COT extreme /
The very large stress that has built up in Cocoa market indicates that the fuel in this recent rally is running out…
I wish all of you good luck to this week’s trading,
All the best,
Dunstan
the original COT report
COT charts
Commitments of Traders basics