Hi everyone,
The latest Commitments of Traders review is out.
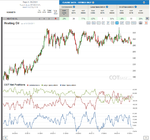
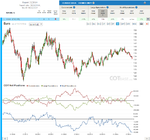
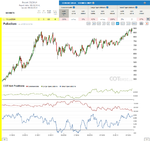
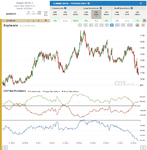
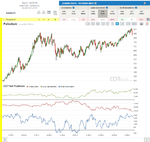
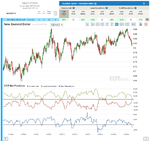
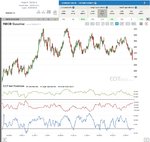
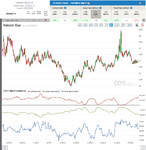
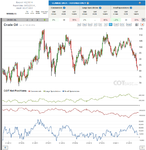
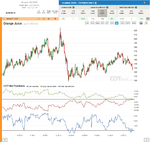
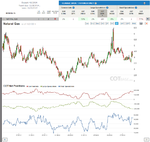
Heating Oil
COT Change (52W) / C – 15%, LS – 13%, SS – 18% /
The largest change in Commercials positions was in Heating Oil this week, so we definitely have a cot signal that we can act on. Of course examining the chart closer, we can see that two weeks ago we had an even greater change that most probably already influenced prices and that is why we see rising prices. You may ask logically if this is gonna continue? Well the extreme situation in the market also supports further rises in Heating Oil I believe.
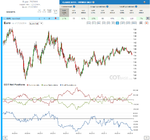
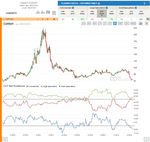
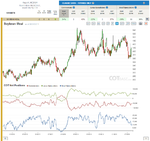
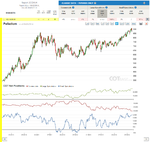
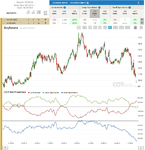
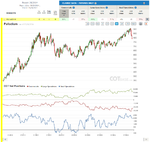
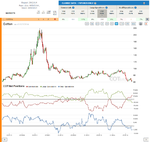
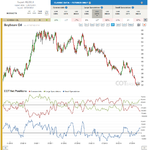
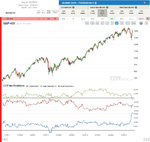
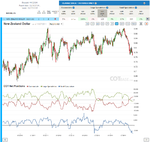
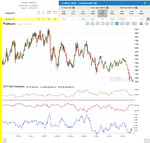
Euro
COT Change (52W) / C – 14%, LS – 16% /
COT Extreme / C –99, LS – 86, SS – 110 report COT extreme /
The change signal and the extreme we have in Euro both point upwards… If you look at small specs, you can find them as pessimistic about the market as they were back in mid 2012 when we Euro reached an important bottom. Prices may of course continue their fall, but I don’t think it would last too long…
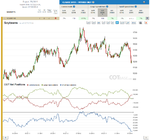
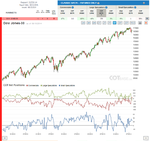
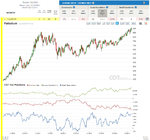
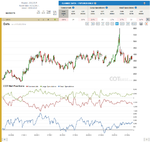
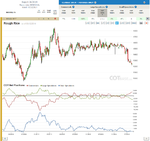
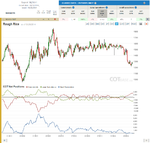
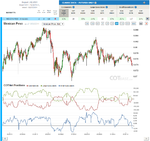
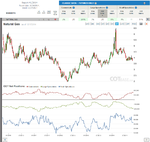
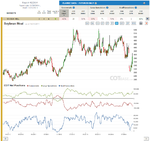
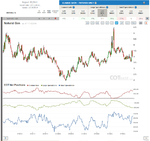
Soybeans
COT Extreme / C – 430, LS – 406 report, SS – All Time COT extreme /
Do I really need to say anything here? 🙂 The pictures says it all!! (unquestionable large cot buy signal)
I’ll be out for a summer holiday during the next two reports, so sorry in advance for not posting. I’ll be back for the 32nd cot report this year.
All the best,
Dunstan
the original COT report
COT charts
The latest Commitments of Traders review is out.
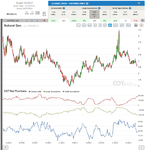
Heating Oil
COT Change (52W) / C – 15%, LS – 13%, SS – 18% /
The largest change in Commercials positions was in Heating Oil this week, so we definitely have a cot signal that we can act on. Of course examining the chart closer, we can see that two weeks ago we had an even greater change that most probably already influenced prices and that is why we see rising prices. You may ask logically if this is gonna continue? Well the extreme situation in the market also supports further rises in Heating Oil I believe.
Euro
COT Change (52W) / C – 14%, LS – 16% /
COT Extreme / C –99, LS – 86, SS – 110 report COT extreme /
The change signal and the extreme we have in Euro both point upwards… If you look at small specs, you can find them as pessimistic about the market as they were back in mid 2012 when we Euro reached an important bottom. Prices may of course continue their fall, but I don’t think it would last too long…
Soybeans
COT Extreme / C – 430, LS – 406 report, SS – All Time COT extreme /
Do I really need to say anything here? 🙂 The pictures says it all!! (unquestionable large cot buy signal)
I’ll be out for a summer holiday during the next two reports, so sorry in advance for not posting. I’ll be back for the 32nd cot report this year.
All the best,
Dunstan
the original COT report
COT charts