Hi everyone,
The latest Commitments of Traders review is out.
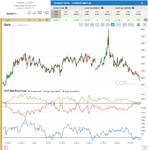
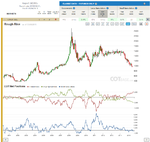
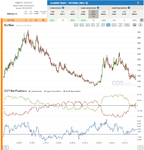
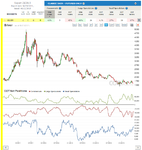
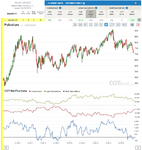
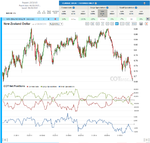
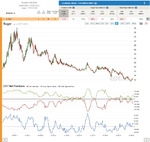
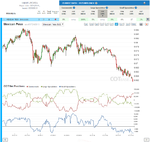
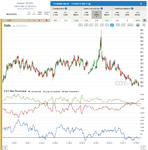
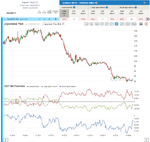
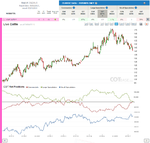
Oats
COT Change (52W) / C – 27%, LS – 32%, SS – 11% /
Both of our main cot signals are bullish: a larger change in Traders positions and also the cot extreme. I think this is a good market with large trading potential in it!
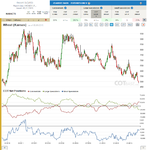
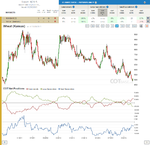
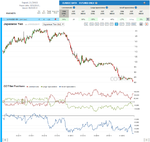
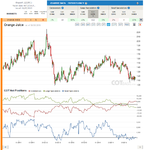
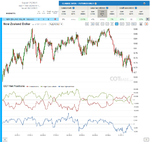
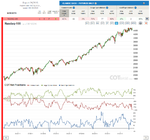
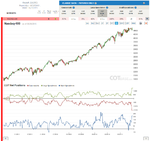
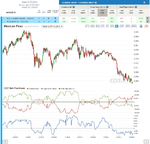
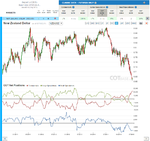
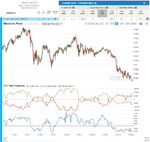
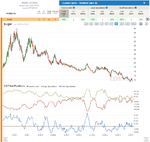
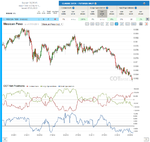
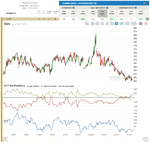
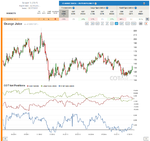
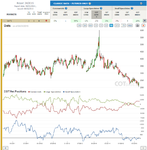
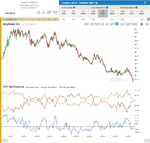
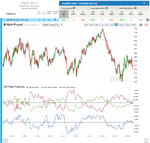
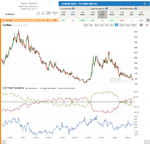
Wheat (both: Chicago and Kansas)
COT Extreme / C, LS – All Time COT extreme /
Prices are still declining, but as they do, stress levels are getting larger day by day… I think these are again great markets with good trading opportunities! Similar to Oats of course, so take into consideration the correlation effect when managing your portfolio.
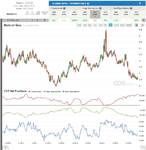
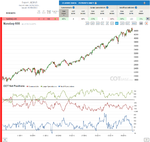
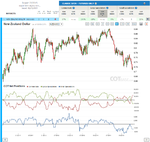
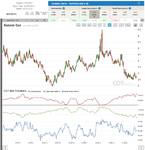
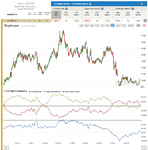
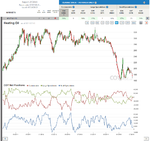
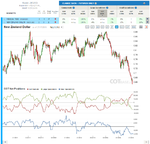
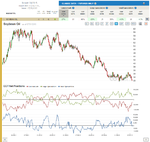
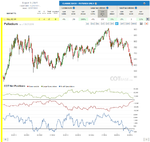
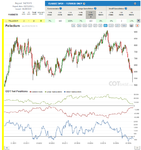
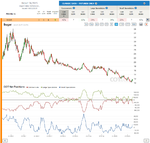
Natural Gas
COT Extreme / C – All Time, LS – 213 report COT extreme /
I thought I’ll jump over rough rice and talk about something new instead🙂 The cot extreme is clearly huge and we have seen confirming price reaction last week, so we may start looking for good entries here!
All the best,
Dunstan
COT Charts
The latest Commitments of Traders review is out.
Oats
COT Change (52W) / C – 27%, LS – 32%, SS – 11% /
Both of our main cot signals are bullish: a larger change in Traders positions and also the cot extreme. I think this is a good market with large trading potential in it!
Wheat (both: Chicago and Kansas)
COT Extreme / C, LS – All Time COT extreme /
Prices are still declining, but as they do, stress levels are getting larger day by day… I think these are again great markets with good trading opportunities! Similar to Oats of course, so take into consideration the correlation effect when managing your portfolio.
Natural Gas
COT Extreme / C – All Time, LS – 213 report COT extreme /
I thought I’ll jump over rough rice and talk about something new instead🙂 The cot extreme is clearly huge and we have seen confirming price reaction last week, so we may start looking for good entries here!
All the best,
Dunstan
COT Charts