Hi everyone,
The latest Commitments of Traders review is out.
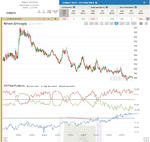
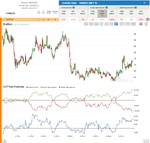
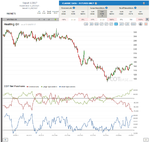
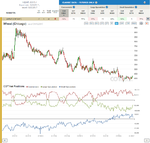
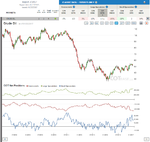
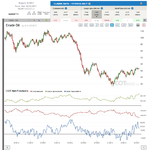
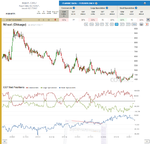
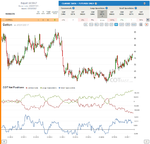
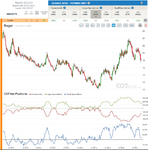
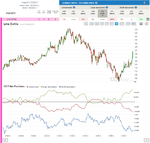
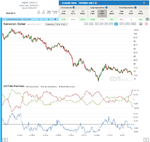
Wheat
COT Change (52W) / C – 30%, LS – 30%, SS – 8% /
We have a 30% bearish cot change signal – I wouldn’t act on it – and a cot extreme picture showing bullishness… I’d step aside from this market for now.
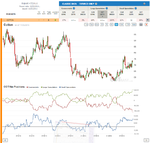
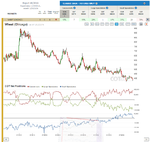
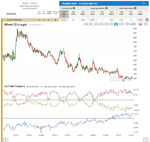
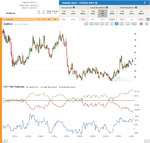
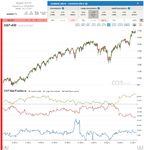
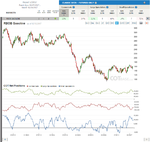
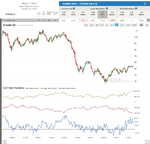
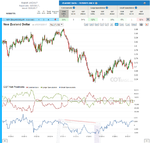
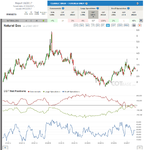
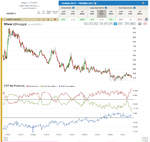
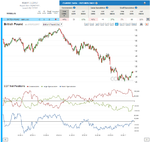
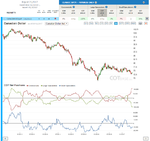
Cotton
COT Extreme / C, LS – All Time COT extreme /
Although we’ve got an all time cot extreme, I’m not that confident that cotton will change it’s path for now. I will wait for further increase in the stress level.
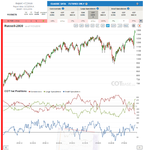
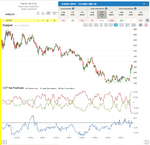
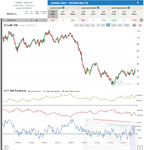
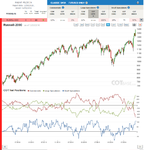
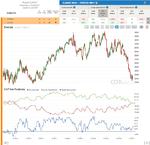
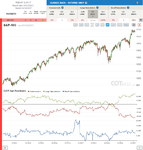
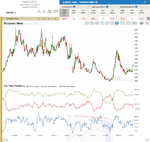
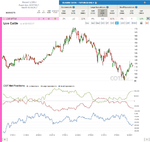
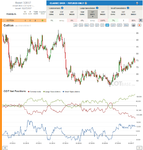
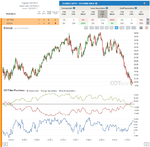
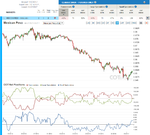
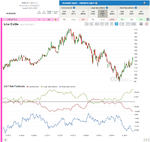
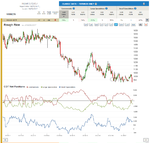
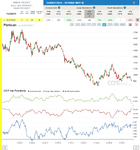
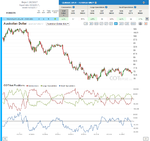
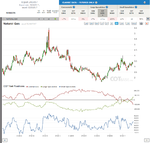
Russel-2000
COT Extreme / C, LS – All Time COT extreme /
All Time cot extreme in all major participants positions, but trading indexes these days is risky business.
All the best,
Dunstan
COT Charts
The latest Commitments of Traders review is out.
Wheat
COT Change (52W) / C – 30%, LS – 30%, SS – 8% /
We have a 30% bearish cot change signal – I wouldn’t act on it – and a cot extreme picture showing bullishness… I’d step aside from this market for now.
Cotton
COT Extreme / C, LS – All Time COT extreme /
Although we’ve got an all time cot extreme, I’m not that confident that cotton will change it’s path for now. I will wait for further increase in the stress level.
Russel-2000
COT Extreme / C, LS – All Time COT extreme /
All Time cot extreme in all major participants positions, but trading indexes these days is risky business.
All the best,
Dunstan
COT Charts