Best Thread Follow the Smart Money / COT Analysis

Hi! What you think about oil market?

I would no be surprised to see oil further rise even if we have this all time bearish extreme in the market. I remember back in 2007 when there was a similar situation, but prices still went higher.

All the best,
Dunstan
 

Attachments

  • Crude Oil.png
    Crude Oil.png
    66.6 KB · Views: 59
Hi everyone,

The latest Commitments of Traders review is out.

S&P-500
COT Change (52W) / C – 33%, LS – 25%, SS – 39% /
Bearish cot change signal and bearish extreme, but I’d pass… Indexes are simply too risky to short now I believe…

Curde Oil
COT Extreme / C, LS – All Time COT extreme /
The all time cot extreme in CL has risen to even greater levels, but price has not yet fallen too deep.

S&P-400
COT Extreme / C – All Time COT extreme /
All Time cot extreme in Commercials, supporting S&P-500 bearish bias...

All the best,
Dunstan

COT Charts
 

Attachments

  • Report49_S&P-500.png
    Report49_S&P-500.png
    111.2 KB · Views: 50
  • Report49_Crude Oil.png
    Report49_Crude Oil.png
    93.2 KB · Views: 46
  • Report49_S&P-400.png
    Report49_S&P-400.png
    92.2 KB · Views: 41
Hi everyone,

The latest Commitments of Traders review is out.

Australian Dollar
COT Change (52W) / C – 45%, LS – 59%, SS – 12% /
Both of our major cot signals are showing positive signs for the market: we have had a major change in Traders positions and with it we have reached a considerable bullish stress level. I would say that the chances are high for further increase.

Coffee
COT Extreme / C, LS – All Time COT extreme /
The picture speaks for itself! Beautiful bullish extreme close to support levels.

30-Year Bond
COT Extreme / LS – 679 report COT extreme /
Interesting to see such a large bearish extreme when prices are not actually that high… I wouldn’t be betting large on further declines, but who knows. I would rather look for other opportunities that are more obvious (like coffee for example).

All the best,
Dunstan

COT Charts
 

Attachments

  • Report51_30-Year Bond.png
    Report51_30-Year Bond.png
    106.8 KB · Views: 45
  • Report51_Coffee.png
    Report51_Coffee.png
    103.1 KB · Views: 45
  • Report51_AUD.png
    Report51_AUD.png
    106.7 KB · Views: 48
Hi everyone,

The latest Commitments of Traders review is out.

S&P-500
COT Change (52W) / C – 26%, LS – 28%, SS – 15% /
Not only do we have a bearish cot change signal in the market, but we have the extreme risen to pretty large levels again. The cot report is definitely backing the notion that we are in a bubble :)

Euro
COT Extreme / C, LS – All Time COT extreme /
We have never seen Large Speculators being so bullish about Euro in the past, so we can assume that it is likely we will see an end to rally in Euro soon…

Heating Oil
COT Extreme / C, LS – All Time COT extreme /
The picture is pretty clear here as well… (ohh I just love these all-time cot extreme signals…) We should start positioning ourselves for a more bearish market to come

All the best,
Dunstan

COT Charts
 

Attachments

  • Report1_S&P-500.png
    Report1_S&P-500.png
    111.6 KB · Views: 44
  • Report1_Euro.png
    Report1_Euro.png
    95.9 KB · Views: 32
  • Report1_Heating Oil.png
    Report1_Heating Oil.png
    107.1 KB · Views: 38
Hi everyone,

The latest Commitments of Traders review is out.

S&P-500
COT Change (52W) / C – 35%, LS – 53%, SS – 10% /
One word: Crazy…

Euro
COT Extreme / C, LS – All Time COT extreme /
As the market moved further up, the extreme has become even greater… The question is not IF it is going to burst, but WHEN?

Heating Oil
COT Extreme / LS – All Time COT extreme /
Not much changed from last week. Prices could not gain too much, but the extreme became larger.

All the best,
Dunstan

COT Charts
 

Attachments

  • Report2_Euro.png
    Report2_Euro.png
    108.2 KB · Views: 38
  • Report2_Heating Oil.png
    Report2_Heating Oil.png
    121.4 KB · Views: 44
  • Report2_S&P-500.png
    Report2_S&P-500.png
    125.1 KB · Views: 43
Hi everyone,

The latest Commitments of Traders review is out.

Natural Gas
COT Change (52W) / C – 28%, LS – 30%, SS – 12% /
Due to the bearish cot change signal we could see a bit of a decline in the market, but the fact that the last cot extreme signal was bullish and effective, we should be prepared for further rallies in Natural Gas.

Crude Oil
COT Extreme / C, LS – All Time COT extreme /
All Time bearish cot extreme, but (!) caution is advised as stated in the cot review -> these extremes can stay for a few weeks or even months before the market trend starts to shift.

British Pound
COT Extreme / LS – 174 report COT extreme /
Not an all time extreme, but significant enough to be careful. The cot report is signaling an end to the rally in GBP.

All the best,
Dunstan

COT Charts
 

Attachments

  • Report3_NG.png
    Report3_NG.png
    111.5 KB · Views: 47
  • Report3_CL.png
    Report3_CL.png
    104.8 KB · Views: 43
  • Report3_GBP.png
    Report3_GBP.png
    115 KB · Views: 36
Hi everyone,

Sorry for being out for so long, have been struggling with a virus... getting better:)

I just wanted to let you know that I have been monitoring this new service that COTbase has built, it is called Futures Trading Guides. Check out the results, really impressive! I have been testing it in my own trading and to tell you the truth, I am pretty satisfied with what I see! :)

You can see the system here:

All the best,
Dunstan
 

Attachments

  • Results for January 31 2018.png
    Results for January 31 2018.png
    64.8 KB · Views: 46
Hi everyone!

This thread I’m just opening, would like to share ideas about trading in the futures market using a simple but very effective tool, the Commitments of Traders report. I would be very much interested in your experiences and thoughts about this data and how it has helped your trading!

Personally I have first seen this data set roughly five years ago, and “fell in love with it” right away! :D :love:
The concept that amused me at the time was that with this COT report you get a legal inside look in the markets --> you get to know what the main participants of these markets are doing!

If you are new to this report, let me explain to you the basics:

Who provides the COT report?
The report is prepared by the Commodity Futures Trading Commission (CFTC)

What does COT report show me?
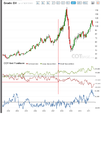
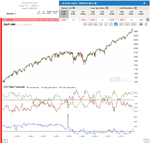
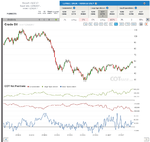
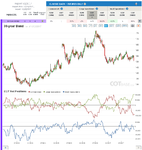
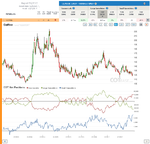
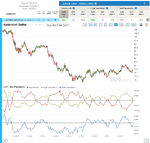
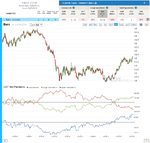
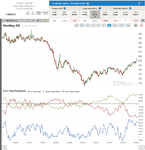
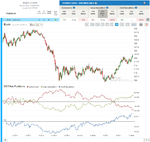
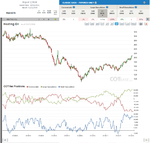
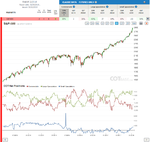
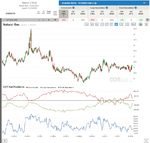
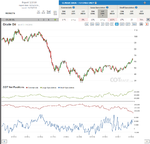
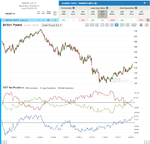
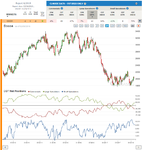
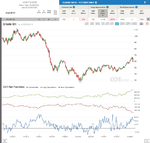
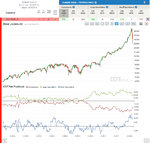
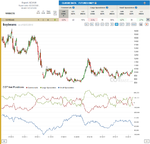
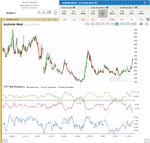
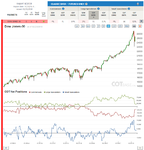
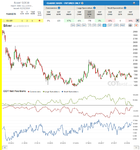
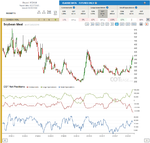
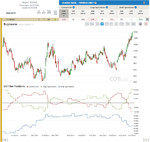
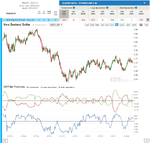
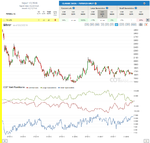
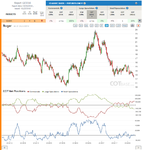
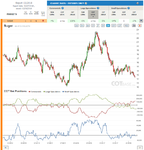
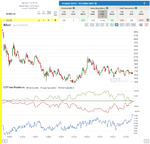
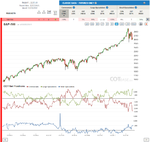
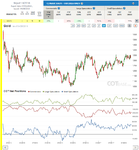
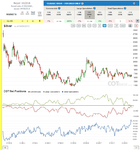
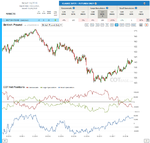
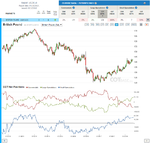
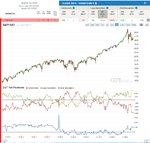
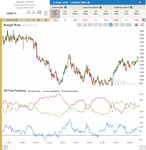
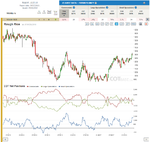
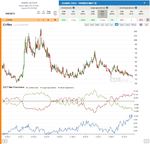
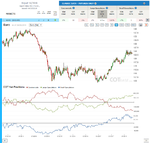
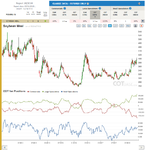
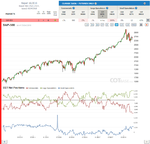
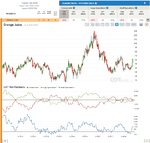
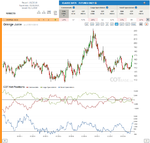
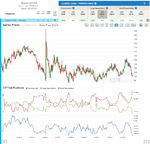
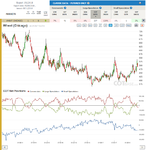
The Commitments of Traders (COT) reports provide a breakdown of each Tuesday’s open interest for markets in which 20 or more traders hold positions equal to or above the reporting levels established by the CFTC. It separates traders into three groups: Commercials, Large Speculators and Small Speculators. Commercials are those participants of the market who either produce that specific commodity or use it for the daily business. Large Speculators are generally big investors, hedge funds holding more contracts than the reporting limits, Small Speculators are the “rest” (you and me, who hold fewer contracts than the reporting limit. Conclusion: So basically the report shows you where these participants are standing on Tuesdays.
For an illustrated good explanation, I’ve found this video on YouTube, it explains everything in understandable English what the Commitments of Traders report is about.

When does the report come out and where can I access it?
It comes out usually on Fridays, but on holidays (such as 4th of July) it comes out usually the next week Monday. This is a free data that CFTC publishes every week and is accessible on it’s site (here).

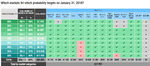
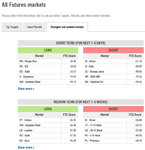
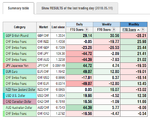
For many years I had to go through a relatively difficult process of first downloading the COT data, converting it to usable format and then importing it in adequate program. If you check CFTC’s site, you will find that the data there is in a raw format that is hard to read… Well these days there are a few services that provide this data in an easily readable, graphical format. I’ve checked most of them, I think this one can be considered the best. I like it because it has the cleanest data available (combined and corrected data) and all the COT report types that are available today!

Let’s get down to business… How does the COT report help my trading?
Well since now we know that it gives you a legal insight on major market participants positions, simply – in accordance with the threads title – you just have to follow the Smart Money! Ok-ok… you might say: “yeah, sure, but who is the smart money?” Well doing your homework and studying the historical reports (the classic COT report has been published since 1986), you will easily see that at certain times, especially in extreme COT situations, knowing where the major players are positioned, will help you enter on the right side of the market.

I’ll show you some great examples soon, but for now, let me leave the “story” at this stage, I would be very much interested in your thoughts and ideas, so please share them with me and if you have any questions, I’ll try my very best to answer them!

All the best,
D

COT It was a tool used in 90´s, it was very easy to see where are Imbalances, 10 years later with a sexy tools like Footprint you see very clear where are the in a bar, now COT is a very incorrect word, in modern trading COT change to Cluster, why? because Algos are programed to take out orders in COT, and is not commitement of trader anymore, because inst very acurated and not very respected....

This is a reason why market makers dont use anymore footprint, because dont mean nothing with HFT and algos tradings, COT in a swing always is a VPOC, well, this is a place where i not trade...

and i show a litle exemple bellow withe COT or Cluster, or VPOC of swing are not recpected: ES.png


my 2 cent.
 
Hello Rachas.

Don't understand what either of you is talking about - but I love Oporto.
Obrigado.
 
Hi everyone,

The latest Commitments of Traders review is out.

Dow Jones-30
COT Change (52W) / C – 57%, LS – 42%, SS – 34% /
Huge bullish cot change signal, but we should not be surprised, since there has been a very large drop in prices. The signal suggests higher prices early this week.

Crude Oil
COT Extreme / LS – All Time COT extreme /
Last week’s decline may have confirmed the top we have been waiting for since we have had this all time cot extreme in the market.

Cocoa
COT Extreme / C – 65, LS – 64 report COT extreme /
Not much here… I’d say that the last major bullish cot extreme is still in place: I’m expecting higher prices to come.

You may want to check out the following cool video about FuturesTradingGuides.com, the service I have mentioned not long ago. They have enhanced their results page and you can now see the system’s performance on a longer time horizon!

All the best,
Dunstan

COT Charts
 

Attachments

  • Report6_Cocoa.png
    Report6_Cocoa.png
    114.6 KB · Views: 76
  • Report6_Crude Oil.png
    Report6_Crude Oil.png
    104.5 KB · Views: 72
  • Report6_Dow Jones-30.png
    Report6_Dow Jones-30.png
    120.1 KB · Views: 72
COT data shows past information if it provides edge on continuous basis and publicly available, efficient market hypothesis says this information is already priced in :(

Cot data has little benefit of course you can spot some interesting shifts in positions but you'll probably find it difficult to base any forecasts on them
 
Hi everyone,

The latest Commitments of Traders review is out.

Soybeans
COT Change (52W) / C – 22%, LS – 21%, SS – 12% /
The cot change signal is clearly bearish (maybe influencing the market early this week), but the extreme is not that obvious. Large Speculators were at these levels roughly a year ago, but other than that, the bullish cot extreme from 5 weeks ago is still acting. So my assumption is this: we may see a bit of a decline, but it should not be long lived and thus we could easily see the continuation of the rally.

Soybean Meal
COT Extreme / C, LS – All Time COT extreme /
Unquestionable bearish cot extreme --> be prepared for lower prices to come.

Dow Jones-30
COT Extreme / C, LS – 91 report COT extreme /
Interesting to get to a bullish extreme so fast (under a month), but looking at the price action, our surprise should be washed away:)

All the best,
Dunstan

COT Charts
Futures Trading
 

Attachments

  • Report8_Soybeans.png
    Report8_Soybeans.png
    116.1 KB · Views: 120
  • Report8_Soybean MEal.png
    Report8_Soybean MEal.png
    120 KB · Views: 100
  • Report8_Dow Jones-30.png
    Report8_Dow Jones-30.png
    116.3 KB · Views: 82
Hi everyone,

The latest Commitments of Traders review is out.

Soybeans
COT Change (52W) / C – 22%, LS – 19%, SS – 5% /
COT Extreme / C - 53, LS – 52 report COT extreme /
The rally continued, the extreme became larger, but it is questionable whether or not it is large enough to make any changes to the rally. The cot change signal suggest a pullback in this rally.

Soybean Meal
COT Extreme / C, LS – All Time COT extreme /
The extreme became even greater… Eyes on this market ;)

Silver
COT Extreme / C - 133, LS – 778 report COT extreme /
Huge bullish cot extreme in Silver suggesting higher prices to come!

All the best,
Dunstan

COT Charts
Futures Trading
 

Attachments

  • Report9_Silver.png
    Report9_Silver.png
    114.5 KB · Views: 88
  • Report9_Soybean Meal.png
    Report9_Soybean Meal.png
    118.9 KB · Views: 81
  • Report9_Soybeans.png
    Report9_Soybeans.png
    90.5 KB · Views: 93
Hi everyone,

The latest Commitments of Traders review is out.

New Zealand Dollar
COT Change (52W) / C – 38%, LS – 42% /
Not only do we have a very large change in Traders positions, with this move we have gone much closer towards a significant bearish cot extreme.

Silver
COT Extreme / C, LS – All Time COT extreme /
All Time bullish cot extreme in Silver. Do I need to say more?? :)

Sugar
COT Extreme / C, LS – All Time COT extreme /
Here we need to be a bit more careful… As you may see on the chart, we have had significant bullish extreme in the market for a loooong time, but the downtrend did not stop. This signal from the report simply underlines the importance of keeping in mind that there is a never before seen stress level in Sugar that will eventually pop and we will see higher prices. This could start tomorrow, but it may also take many months before something happens.

All the best,
Dunstan

COT Charts
Futures Trading
 

Attachments

  • Report12_NZD.png
    Report12_NZD.png
    124 KB · Views: 74
  • Report12_Silver.png
    Report12_Silver.png
    118 KB · Views: 69
  • Report12_Sugar.png
    Report12_Sugar.png
    107 KB · Views: 74
Hi everyone,

The latest Commitments of Traders review is out.

S&P-500
COT Change (52W) / C – 38%, LS – 56% /
COT Extreme / LS – All Time COT extreme /
Both of our main COT signals are giving us bearish signs in the market. Huge changes in Commercials and in Large Specs positions combined with an All Time cot extreme signal in LS (despite the decline in the market we have witnessed the last 2 monhts).

Silver
COT Extreme / LS – All Time COT extreme /
Not much change since last week… LS further increased their net short position.

Sugar
COT Extreme / C, LS – All Time COT extreme /
Similarly to Silver, the stress level in the market has increased, the bullish cot extreme became even more significant, yet prices further declined. This underlines my caution advice I made last week.

All the best,
Dunstan

COT Charts
Futures Trading
 

Attachments

  • Report13_Sugar.png
    Report13_Sugar.png
    106.8 KB · Views: 62
  • Report13_Silver.png
    Report13_Silver.png
    116.7 KB · Views: 67
  • Report13_S&P-500.png
    Report13_S&P-500.png
    124.5 KB · Views: 60
Hi everyone,

The latest Commitments of Traders review is out.

Gold
COT Change (52W) / C – 19%, LS – 19% /
Bullish cot change signal possibly pushing prices higher the next few days, but no extreme.

Silver
COT Extreme / C, LS – All Time COT extreme /
Further increase in the cot extreme here. Great example that all time extremes could be with us for pretty long time before the market reacts. FuturesTradingGuides is indicating a -51.79 FTG score on a short time frame and a -56.99 FTG score for medium term so actually even though we have this huge bullish extreme, I’m waiting…

British Pound
COT Extreme / C - 193, LS – 194 report COT extreme /
Huge Bearish cot extreme in GBP suggesting an end to this rally we have been witnessing since the beginning of 2017.

All the best,
Dunstan

COT Charts
Futures Trading
 

Attachments

  • Report14_Gold.png
    Report14_Gold.png
    107.8 KB · Views: 58
  • Report14_Silver.png
    Report14_Silver.png
    112.5 KB · Views: 53
  • Report14_GBP.png
    Report14_GBP.png
    115.6 KB · Views: 55
  • FTG_Silver short.png
    FTG_Silver short.png
    51.3 KB · Views: 54
Hi everyone,

The latest Commitments of Traders review is out.

Rough Rice
COT Change (52W) / C – 15%, LS – 10%, SS – 22% /
Although we have this bearish cot change signal, I’d stay away from any short trade. Volume and OI analysis is supporting further rallies in the market and the extreme isn’t that significant either.

S&P-500
COT Extreme / LS – All Time COT extreme /
Interesting to see such a bearish extreme in S&P, when we have nothing similar in Nasdaq and the Dow… tricky situation that’s for sure. Nevertheless if someone is considering shorting here, they may be happy with the fact that the cot report is backing the trade.

British Pound
COT Extreme / C - 194, LS – 196 report COT extreme /
As prices gone higher, the bearish cot extreme has also become larger – no surprise here.

All the best,
Dunstan

COT Charts
Futures Trading
 

Attachments

  • Report15_GBP.png
    Report15_GBP.png
    115.6 KB · Views: 82
  • Report15_S&P-500.png
    Report15_S&P-500.png
    125.6 KB · Views: 78
  • Report15_Rough Rice.png
    Report15_Rough Rice.png
    114.3 KB · Views: 75
Hi everyone,

The latest Commitments of Traders review is out.

Rough Rice
COT Change (52W) / C – 21%, LS – 14%, SS – 31% /
Bearish COT change signal combined with an extreme bearish cot extreme. Eyes on rough Rice.

Coffee
COT Extreme / C, LS – All Time COT extreme /
All time bullish cot extreme in Coffee! Let the chart speak for itself ;)

Euro
COT Extreme / LS – All Time COT extreme /
LS at a bearish cot extreme (all time) suggesting prices should turn downwards.

All the best,
Dunstan

COT Charts
Futures Trading
 

Attachments

  • Report16_Rough Rice.png
    Report16_Rough Rice.png
    117.3 KB · Views: 69
  • Report16_Coffee.png
    Report16_Coffee.png
    115.7 KB · Views: 73
  • Report16_EUR.png
    Report16_EUR.png
    108.5 KB · Views: 70
Hi everyone,

The latest Commitments of Traders review is out.

Orange Juice
COT Change (52W) / C – 28%, LS – 22%, SS – 22% /
The large change in Traders positions suggest that prices may fall back a little, but analyzing the stress level in the market I can except further increases in the next weeks, months ahead.

S&P-500
COT Extreme / LS – All Time COT extreme /
The most bearish of all indexes is the S&P-500. The all time cot extreme makes this clear. I’d be careful though, since the picture seems to be very bullish in Nasdaq and the Dow.

Soybean Meal
COT Extreme / C, LS – All Time COT extreme /
Soybean markets in my experience tend to react very well to cot extreme signals (just take a brief look at some historical examples…), so the fact that we have all time bearish cot extreme in Commercial’s AND Large Speculators positions makes me excited.

All the best,
Dunstan

COT Charts
Futures Trading
 

Attachments

  • Report18_Soybean Meal.png
    Report18_Soybean Meal.png
    114.7 KB · Views: 64
  • Report18_S&P-500.png
    Report18_S&P-500.png
    122.2 KB · Views: 65
  • Report18_Orange Juice.png
    Report18_Orange Juice.png
    112.4 KB · Views: 63
Hi everyone,

The latest Commitments of Traders review is out.

Orange Juice
COT Change (52W) / C – 29%, LS – 26%, SS – 30% /
Nice signal from the change in Traders positions, but I don’t see a big extreme yet.

Swiss Franc
COT Extreme / C – 566, LS – 307 report, SS – All Time COT extreme /
Huge bullish cot extreme in Swiss Franc! In the past the market reacted well to these tense situations, so I’m expecting this to repeat again. I’ve just subscribed to FX Trading Guides and now I can see that I should wait a bit before entering the market. Attached you can see the daily-weekly and monthly FTG scores that measure strength/weakness in the market. I gathered all major currencies with CHF.

Wheat
COT Extreme / C - 41, LS – 207 report COT extreme /
Very large bearish extreme here suggesting further declines to come.

All the best,
Dunstan

COT Charts
FOREX Trading
Futures Trading
 

Attachments

  • Report19_Orange Juice.png
    Report19_Orange Juice.png
    113 KB · Views: 56
  • Report19_CHF.png
    Report19_CHF.png
    120.3 KB · Views: 60
  • FTG Scores_CHF.png
    FTG Scores_CHF.png
    56.4 KB · Views: 59
  • Report19_Wheat.png
    Report19_Wheat.png
    117.3 KB · Views: 58
Top