Yesterday was a choppy day, but I had a look at the market last night just before 7pm and went through all the stocks I'd had on my watch list earlier.
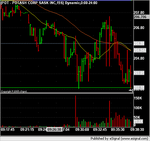
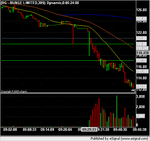
One of them was FITB, identified because of the WB news in the commercial bank sector, weakness in that sector and that it had trended down early in the day - I'd scalped it twice on the way down. FITB continued to move down and I decided to short the break of the pre-7pm low for what looked as if it might be a 5 min candle swing trade.
Short was at $19.39 with an initial stop at the $19.50c level.
The 10 period ema was going to be my guide as the stock had steadily moved down all day and began to head south again.
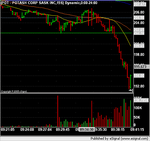
A little later I had a minor retracement against me and I was on the verge of exiting for a 2c loss if it wasn't for two MMs sitting unmoved above the best ask. It headed south again. Only level 2 could have told me that in advance, NOT the chart.
I covered a few minutes from the close and took 37c to add to the scalps earlier in the day.
A couple of points - stocks which move in one direction early in the day often resume their move in the evening and there are almost always good trades to find even on a choppy go-nowhere sort of day, provided you look in the right place. Although the market might not be going in your direction, you are not actually trading the market, you're trading a stock, so although market and sector matter, they are not the be all and end all; the stock is acting individually, BUT with market and sector influences.
In my personal view, it's better not to trade with every market twist and turn on a choppy day as you tend to get chopped up.
You don't spit into the face of an oncoming gale, but you can take a stroll even if the breeze is wafting gently against you.
Works for me anyway.
Richard